| __timestamp | J.B. Hunt Transport Services, Inc. | Rockwell Automation, Inc. |
|---|---|---|
| Wednesday, January 1, 2014 | 1041346000 | 2753900000 |
| Thursday, January 1, 2015 | 1146174000 | 2703100000 |
| Friday, January 1, 2016 | 1185633000 | 2475500000 |
| Sunday, January 1, 2017 | 1199293000 | 2624200000 |
| Monday, January 1, 2018 | 1359217000 | 2872200000 |
| Tuesday, January 1, 2019 | 1506255000 | 2900100000 |
| Wednesday, January 1, 2020 | 1449876000 | 2595200000 |
| Friday, January 1, 2021 | 1869819000 | 2897700000 |
| Saturday, January 1, 2022 | 2472527000 | 3102000000 |
| Sunday, January 1, 2023 | 2396388000 | 3717000000 |
| Monday, January 1, 2024 | 3193400000 |
Unlocking the unknown
In the ever-evolving landscape of American industry, Rockwell Automation, Inc. and J.B. Hunt Transport Services, Inc. stand as titans in their respective fields. Over the past decade, Rockwell Automation has consistently outperformed J.B. Hunt in terms of gross profit, with an average of approximately $2.9 billion annually, compared to J.B. Hunt's $1.6 billion. Notably, Rockwell's gross profit peaked in 2023, reaching an impressive $3.7 billion, marking a 35% increase from 2014. Meanwhile, J.B. Hunt saw its highest gross profit in 2022, with a 137% growth from 2014. However, 2024 data for J.B. Hunt remains elusive, leaving room for speculation. This comparison highlights the resilience and growth potential of these industry leaders, offering valuable insights for investors and market analysts alike.
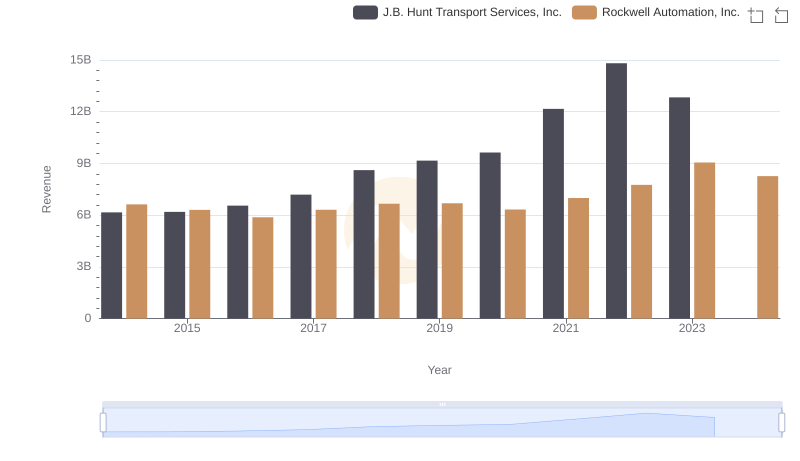
Rockwell Automation, Inc. vs J.B. Hunt Transport Services, Inc.: Annual Revenue Growth Compared
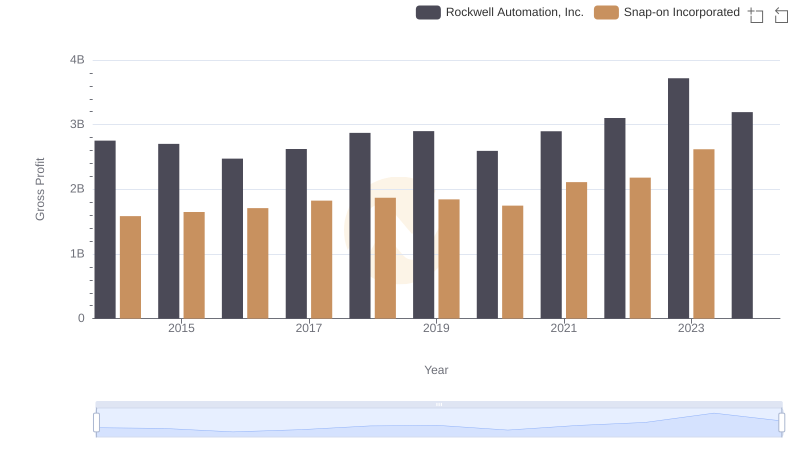
Who Generates Higher Gross Profit? Rockwell Automation, Inc. or Snap-on Incorporated
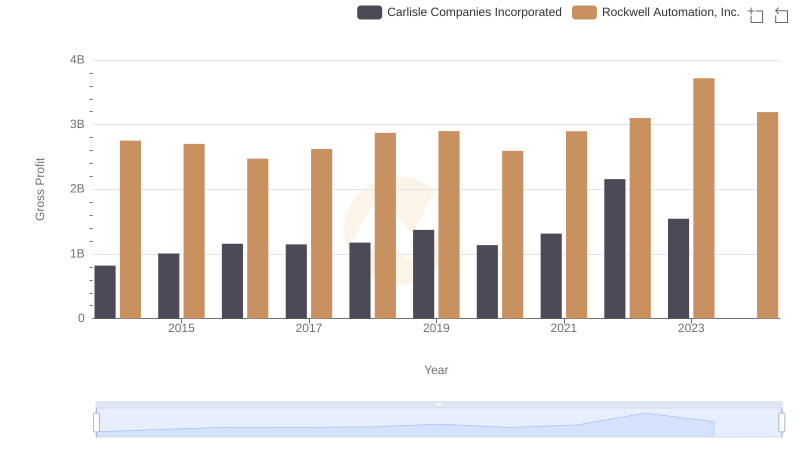
Gross Profit Analysis: Comparing Rockwell Automation, Inc. and Carlisle Companies Incorporated
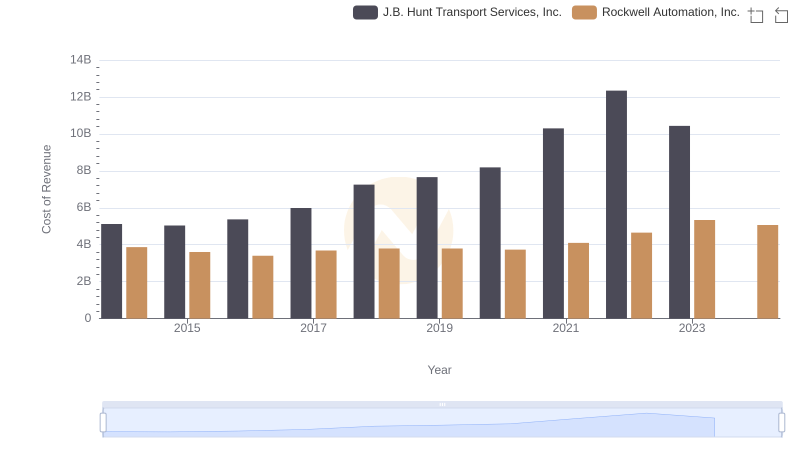
Analyzing Cost of Revenue: Rockwell Automation, Inc. and J.B. Hunt Transport Services, Inc.
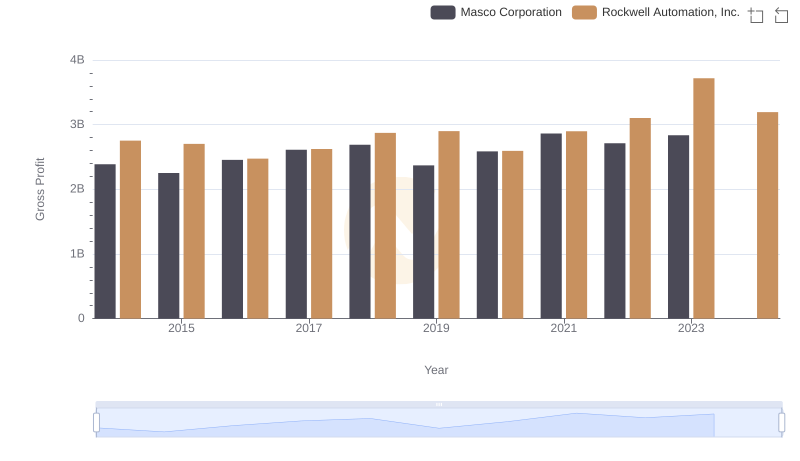
Gross Profit Trends Compared: Rockwell Automation, Inc. vs Masco Corporation
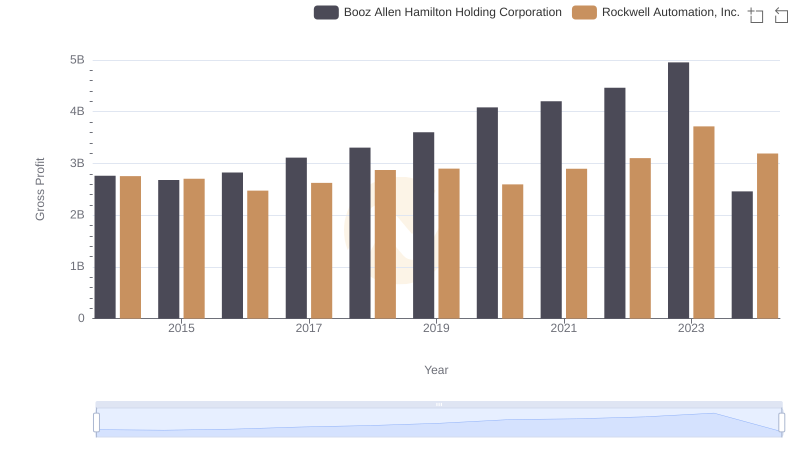
Gross Profit Trends Compared: Rockwell Automation, Inc. vs Booz Allen Hamilton Holding Corporation
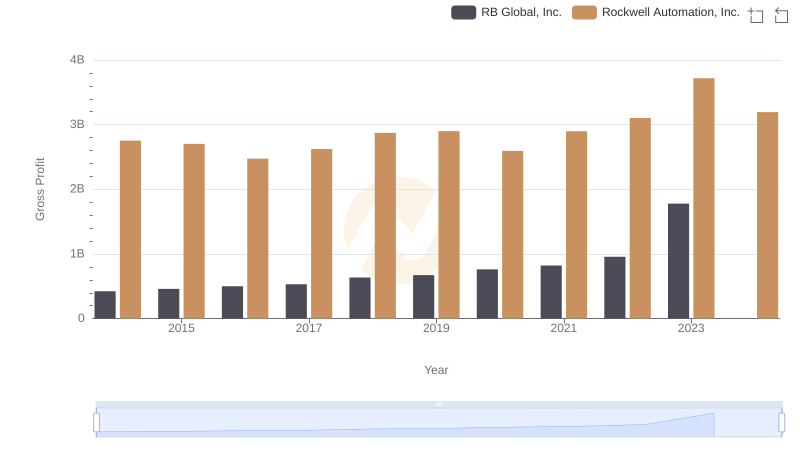
Gross Profit Trends Compared: Rockwell Automation, Inc. vs RB Global, Inc.
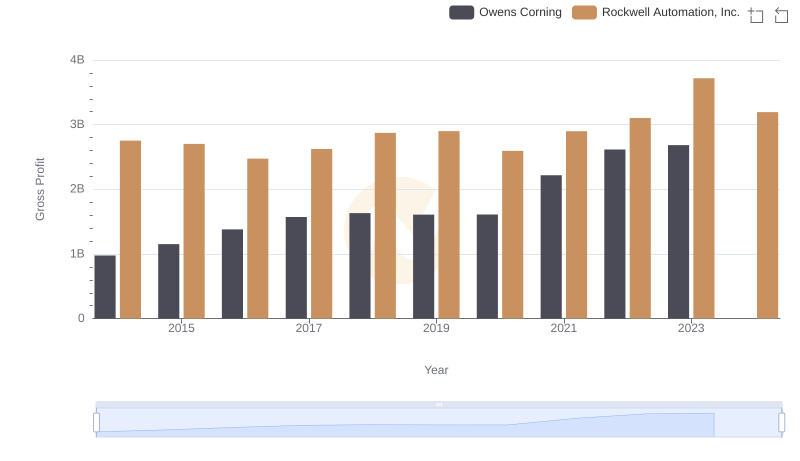
Gross Profit Trends Compared: Rockwell Automation, Inc. vs Owens Corning
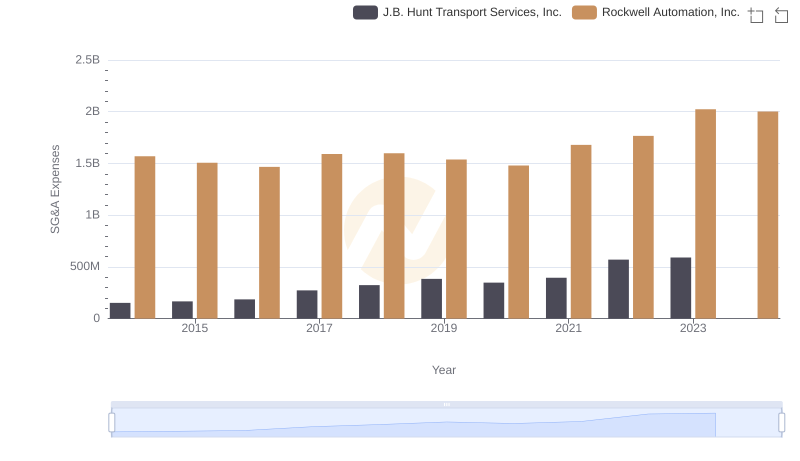
Breaking Down SG&A Expenses: Rockwell Automation, Inc. vs J.B. Hunt Transport Services, Inc.
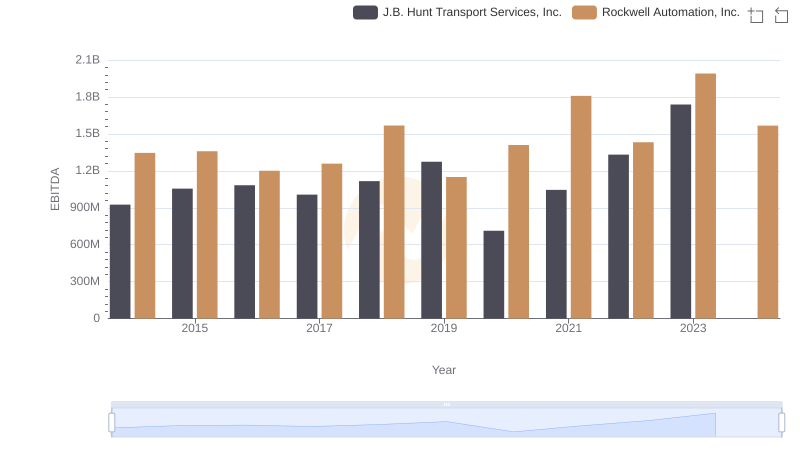
Rockwell Automation, Inc. and J.B. Hunt Transport Services, Inc.: A Detailed Examination of EBITDA Performance