| __timestamp | Masco Corporation | Rockwell Automation, Inc. |
|---|---|---|
| Wednesday, January 1, 2014 | 2387000000 | 2753900000 |
| Thursday, January 1, 2015 | 2253000000 | 2703100000 |
| Friday, January 1, 2016 | 2456000000 | 2475500000 |
| Sunday, January 1, 2017 | 2611000000 | 2624200000 |
| Monday, January 1, 2018 | 2689000000 | 2872200000 |
| Tuesday, January 1, 2019 | 2371000000 | 2900100000 |
| Wednesday, January 1, 2020 | 2587000000 | 2595200000 |
| Friday, January 1, 2021 | 2863000000 | 2897700000 |
| Saturday, January 1, 2022 | 2713000000 | 3102000000 |
| Sunday, January 1, 2023 | 2836000000 | 3717000000 |
| Monday, January 1, 2024 | 2831000000 | 3193400000 |
Unleashing insights
In the competitive landscape of industrial automation and home improvement, Rockwell Automation, Inc. and Masco Corporation have showcased intriguing gross profit trends over the past decade. From 2014 to 2023, Rockwell Automation consistently outperformed Masco, with a notable peak in 2023, achieving a gross profit of approximately $3.7 billion. This represents a remarkable 35% increase from its 2014 figures. Meanwhile, Masco Corporation demonstrated steady growth, peaking in 2023 with a gross profit of around $2.8 billion, marking a 19% rise since 2014.
The data reveals Rockwell's resilience and strategic prowess in maintaining a competitive edge, while Masco's consistent upward trajectory highlights its robust market presence. However, the absence of Masco's 2024 data leaves room for speculation on its future performance. As these industry titans continue to evolve, their financial narratives offer valuable insights into their strategic directions.

Who Generates More Revenue? Rockwell Automation, Inc. or Masco Corporation
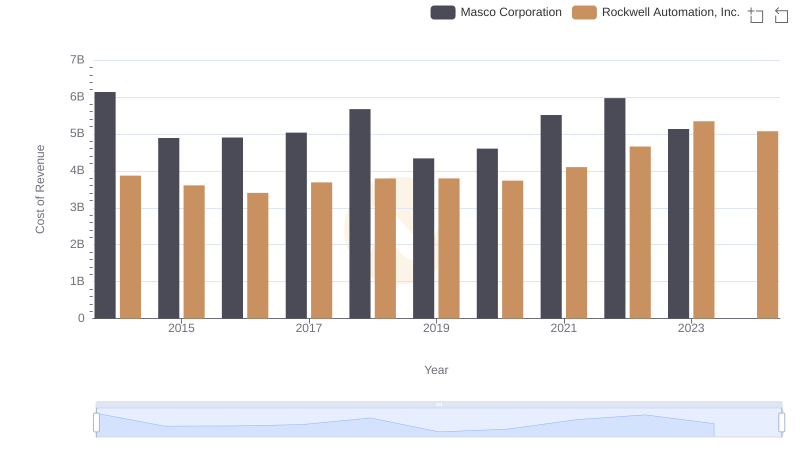
Analyzing Cost of Revenue: Rockwell Automation, Inc. and Masco Corporation
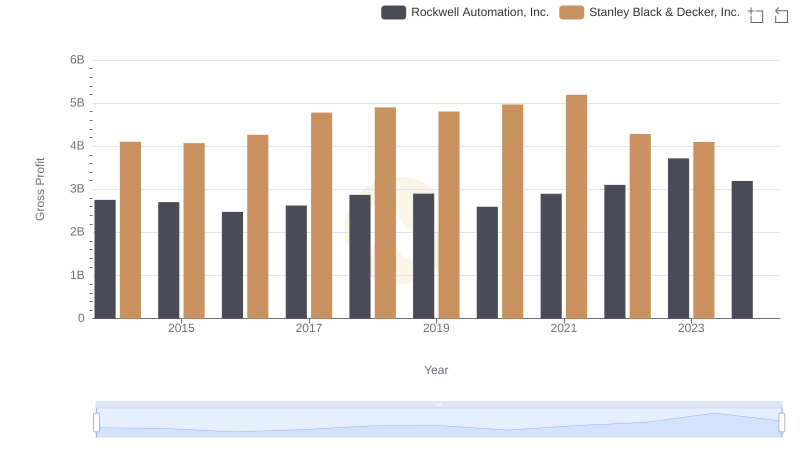
Who Generates Higher Gross Profit? Rockwell Automation, Inc. or Stanley Black & Decker, Inc.
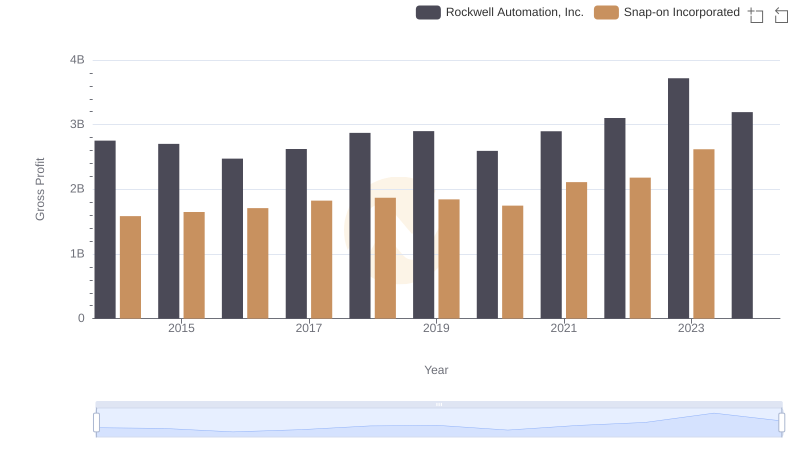
Who Generates Higher Gross Profit? Rockwell Automation, Inc. or Snap-on Incorporated
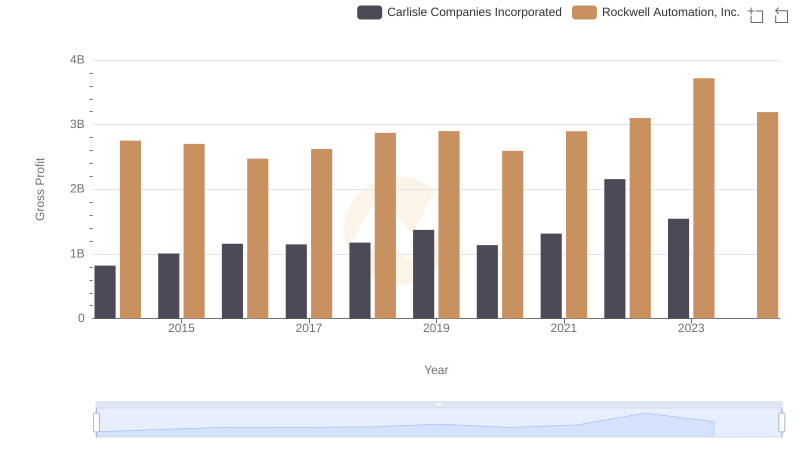
Gross Profit Analysis: Comparing Rockwell Automation, Inc. and Carlisle Companies Incorporated
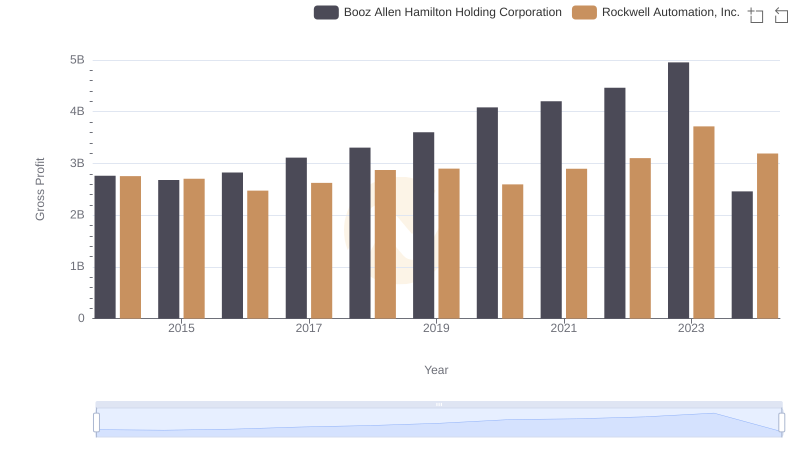
Gross Profit Trends Compared: Rockwell Automation, Inc. vs Booz Allen Hamilton Holding Corporation
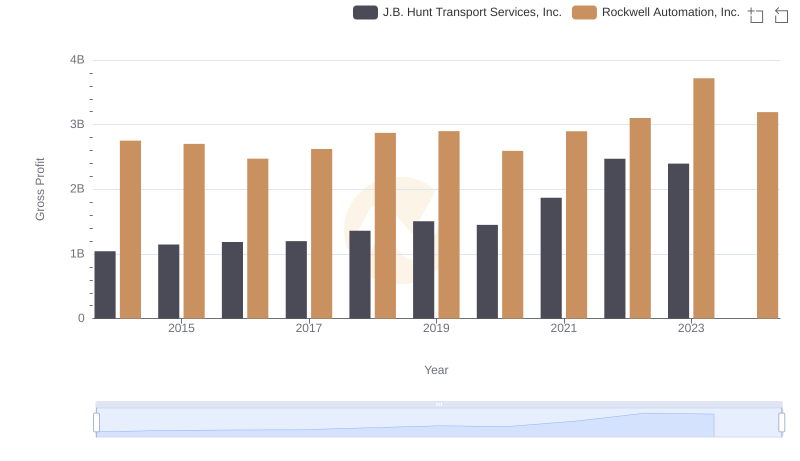
Key Insights on Gross Profit: Rockwell Automation, Inc. vs J.B. Hunt Transport Services, Inc.
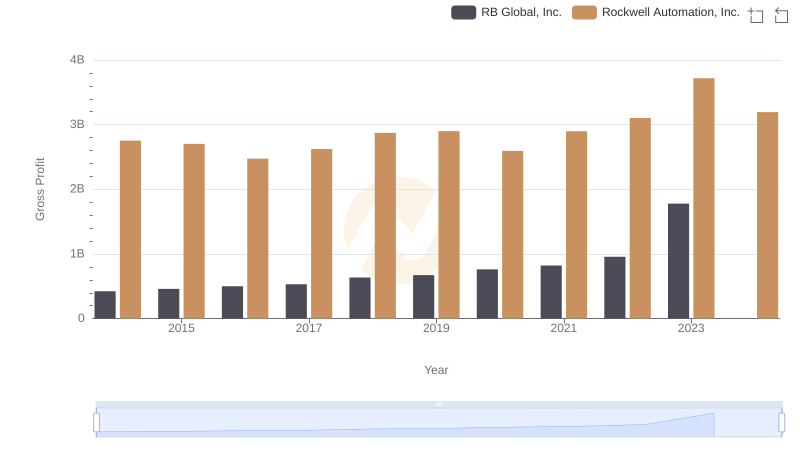
Gross Profit Trends Compared: Rockwell Automation, Inc. vs RB Global, Inc.
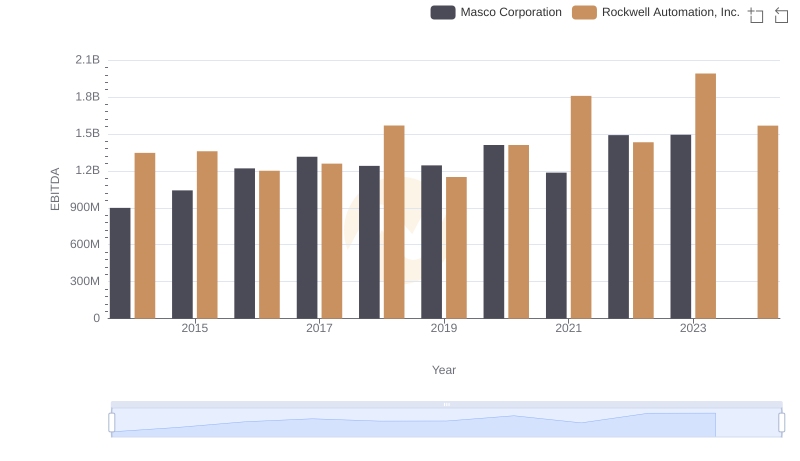
Professional EBITDA Benchmarking: Rockwell Automation, Inc. vs Masco Corporation