| __timestamp | Carlisle Companies Incorporated | Rockwell Automation, Inc. |
|---|---|---|
| Wednesday, January 1, 2014 | 819500000 | 2753900000 |
| Thursday, January 1, 2015 | 1006700000 | 2703100000 |
| Friday, January 1, 2016 | 1157300000 | 2475500000 |
| Sunday, January 1, 2017 | 1148000000 | 2624200000 |
| Monday, January 1, 2018 | 1174700000 | 2872200000 |
| Tuesday, January 1, 2019 | 1371700000 | 2900100000 |
| Wednesday, January 1, 2020 | 1137400000 | 2595200000 |
| Friday, January 1, 2021 | 1314700000 | 2897700000 |
| Saturday, January 1, 2022 | 2157400000 | 3102000000 |
| Sunday, January 1, 2023 | 1544000000 | 3717000000 |
| Monday, January 1, 2024 | 1887700000 | 3193400000 |
Cracking the code
In the ever-evolving landscape of industrial automation and manufacturing, understanding financial performance is crucial. Over the past decade, Rockwell Automation, Inc. has consistently outperformed Carlisle Companies Incorporated in terms of gross profit. From 2014 to 2023, Rockwell Automation's gross profit surged by approximately 35%, peaking in 2023 with a remarkable $3.7 billion. In contrast, Carlisle Companies saw a more modest increase of around 88% during the same period, reaching its highest gross profit in 2022.
These trends highlight the resilience and strategic positioning of Rockwell Automation in the competitive industrial sector, while Carlisle Companies shows potential for growth despite recent fluctuations.
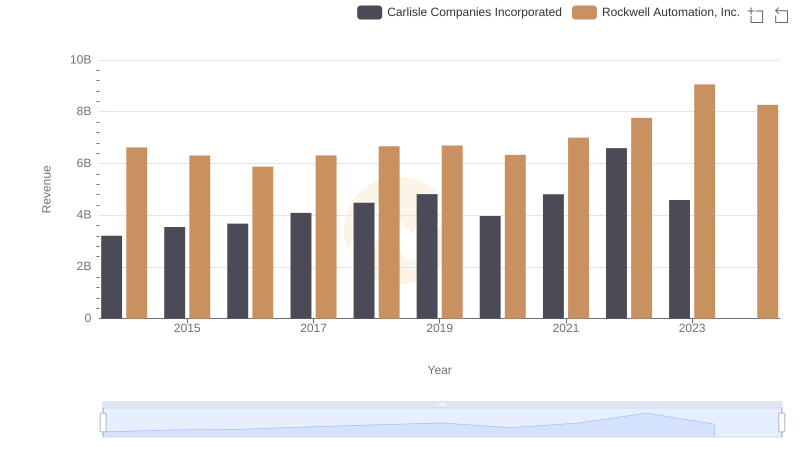
Rockwell Automation, Inc. vs Carlisle Companies Incorporated: Examining Key Revenue Metrics
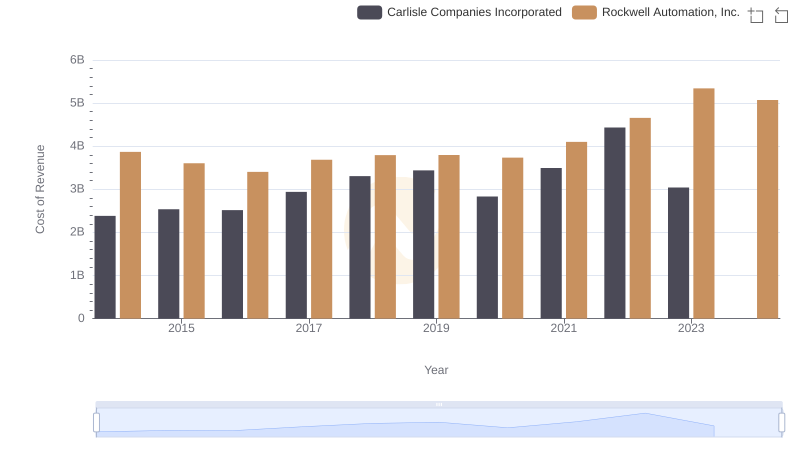
Cost of Revenue Trends: Rockwell Automation, Inc. vs Carlisle Companies Incorporated
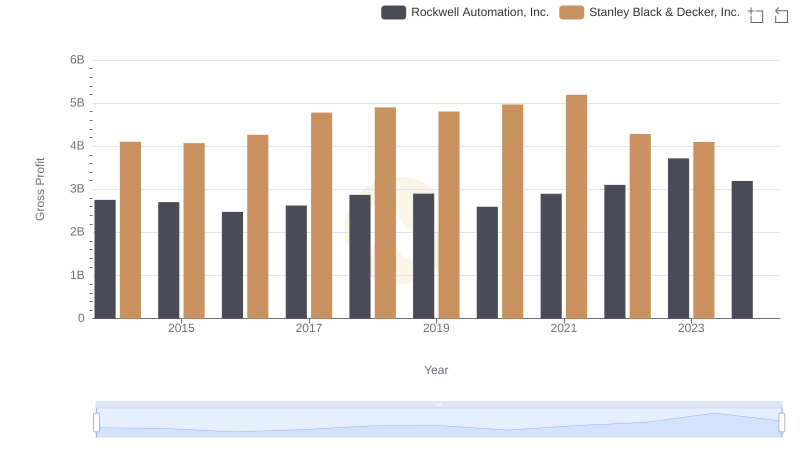
Who Generates Higher Gross Profit? Rockwell Automation, Inc. or Stanley Black & Decker, Inc.
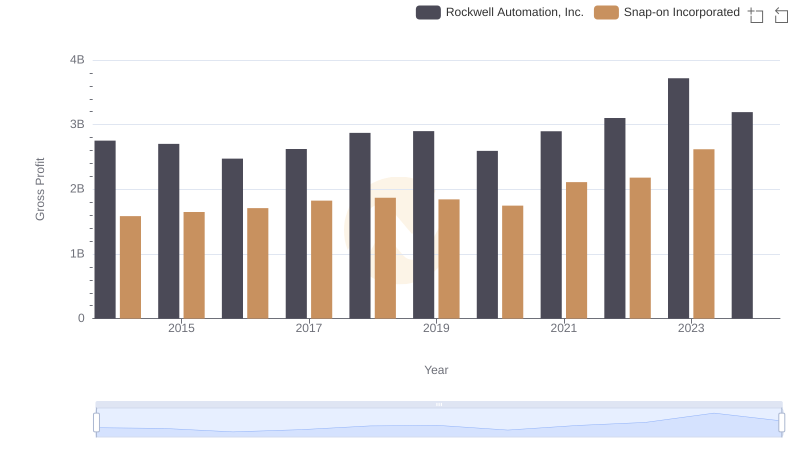
Who Generates Higher Gross Profit? Rockwell Automation, Inc. or Snap-on Incorporated
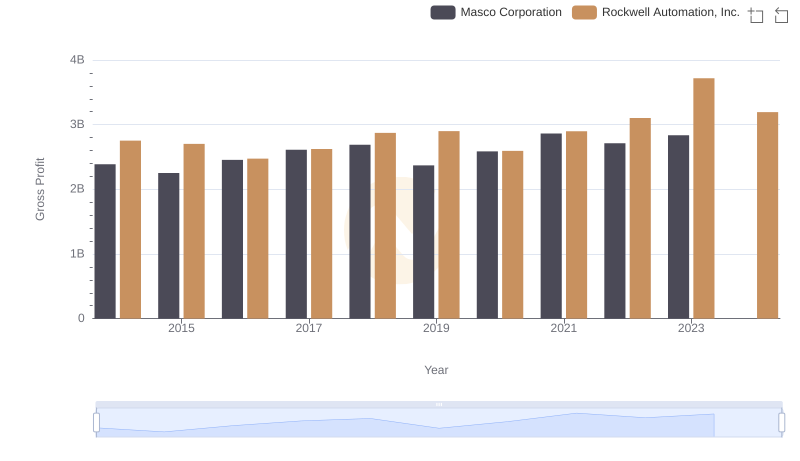
Gross Profit Trends Compared: Rockwell Automation, Inc. vs Masco Corporation
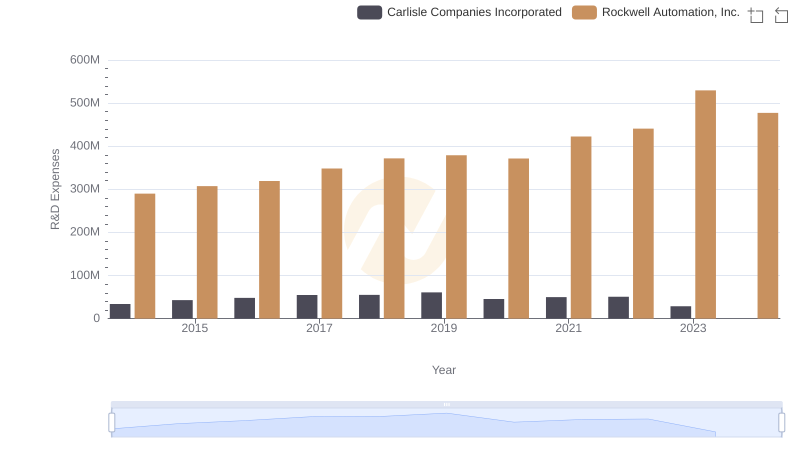
Rockwell Automation, Inc. or Carlisle Companies Incorporated: Who Invests More in Innovation?
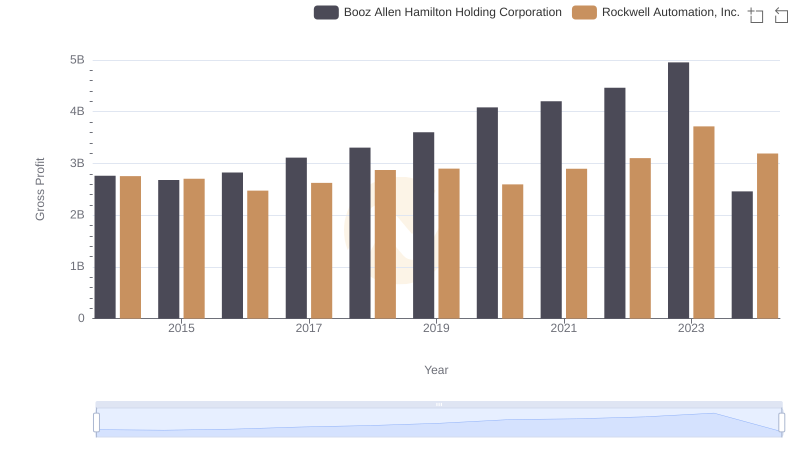
Gross Profit Trends Compared: Rockwell Automation, Inc. vs Booz Allen Hamilton Holding Corporation
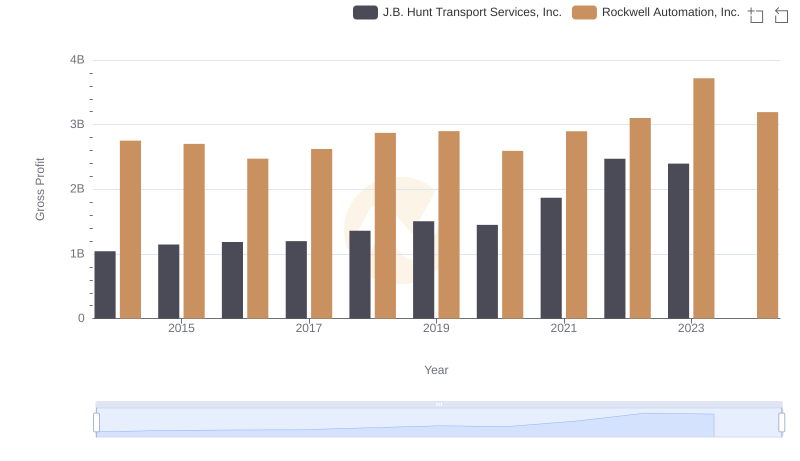
Key Insights on Gross Profit: Rockwell Automation, Inc. vs J.B. Hunt Transport Services, Inc.
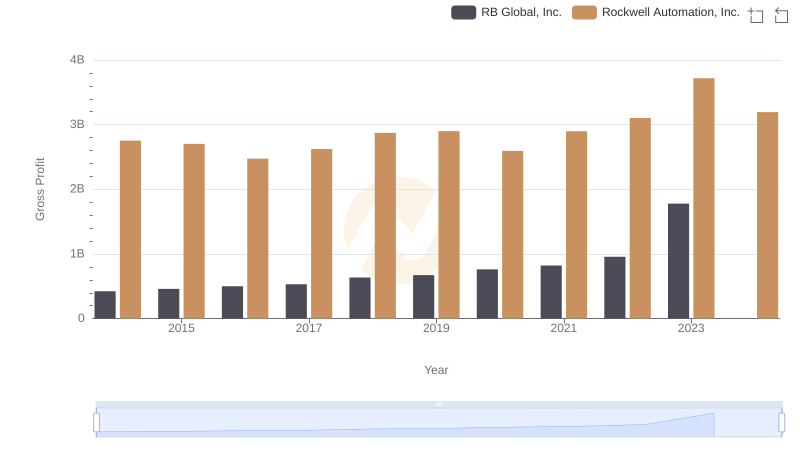
Gross Profit Trends Compared: Rockwell Automation, Inc. vs RB Global, Inc.
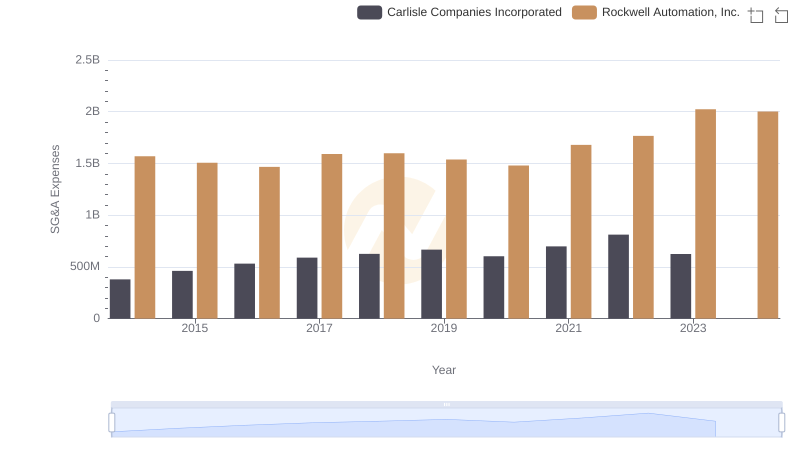
SG&A Efficiency Analysis: Comparing Rockwell Automation, Inc. and Carlisle Companies Incorporated

A Side-by-Side Analysis of EBITDA: Rockwell Automation, Inc. and Carlisle Companies Incorporated