| __timestamp | International Business Machines Corporation | Motorola Solutions, Inc. |
|---|---|---|
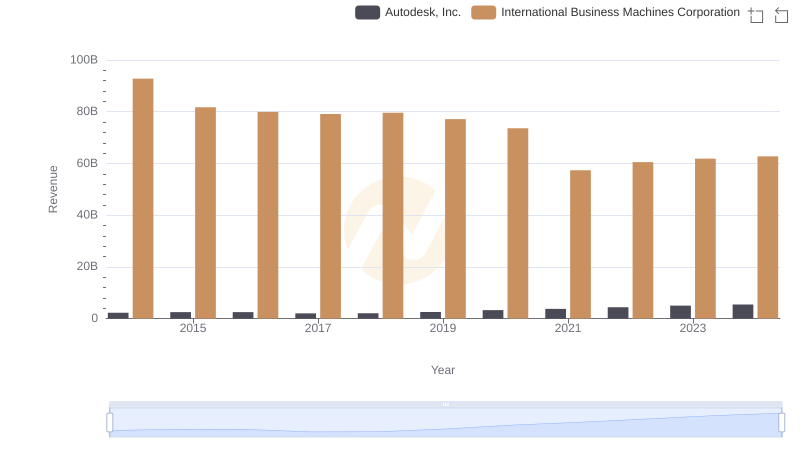
| Wednesday, January 1, 2014 | 92793000000 | 5881000000 |
| Thursday, January 1, 2015 | 81742000000 | 5695000000 |
| Friday, January 1, 2016 | 79920000000 | 6038000000 |
| Sunday, January 1, 2017 | 79139000000 | 6380000000 |
| Monday, January 1, 2018 | 79591000000 | 7343000000 |
| Tuesday, January 1, 2019 | 57714000000 | 7887000000 |
| Wednesday, January 1, 2020 | 55179000000 | 7414000000 |
| Friday, January 1, 2021 | 57351000000 | 8171000000 |
| Saturday, January 1, 2022 | 60530000000 | 9112000000 |
| Sunday, January 1, 2023 | 61860000000 | 9978000000 |
| Monday, January 1, 2024 | 62753000000 | 10817000000 |
Data in motion
In the ever-evolving landscape of technology, International Business Machines Corporation (IBM) and Motorola Solutions, Inc. have been pivotal players. From 2014 to 2023, IBM's revenue trajectory reveals a significant decline of approximately 33%, from its peak in 2014 to its lowest in 2021. However, a resurgence is evident as revenues climbed by about 8% from 2021 to 2023. Meanwhile, Motorola Solutions has shown a steady upward trend, with revenues increasing by nearly 70% over the same period, peaking in 2023. This divergence highlights IBM's challenges in adapting to new market dynamics, while Motorola Solutions capitalizes on its niche in communication solutions. The data for 2024 remains incomplete, leaving room for speculation on future trends. As these companies navigate the complexities of the tech world, their financial narratives offer valuable insights into strategic adaptability and market positioning.
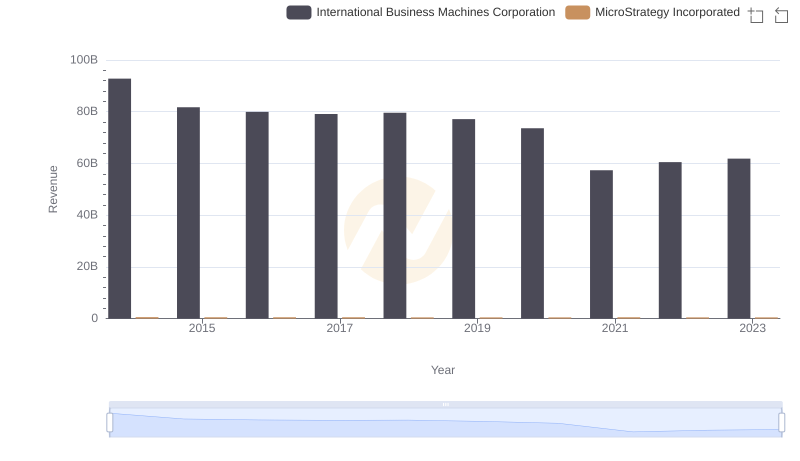
Revenue Insights: International Business Machines Corporation and MicroStrategy Incorporated Performance Compared
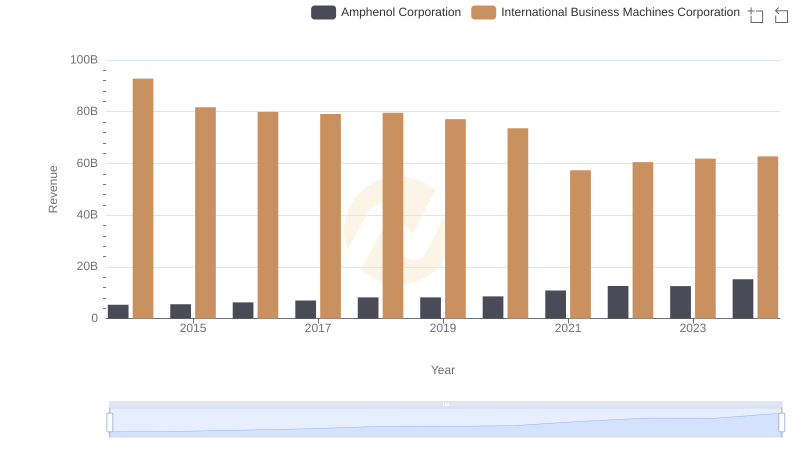
Revenue Insights: International Business Machines Corporation and Amphenol Corporation Performance Compared
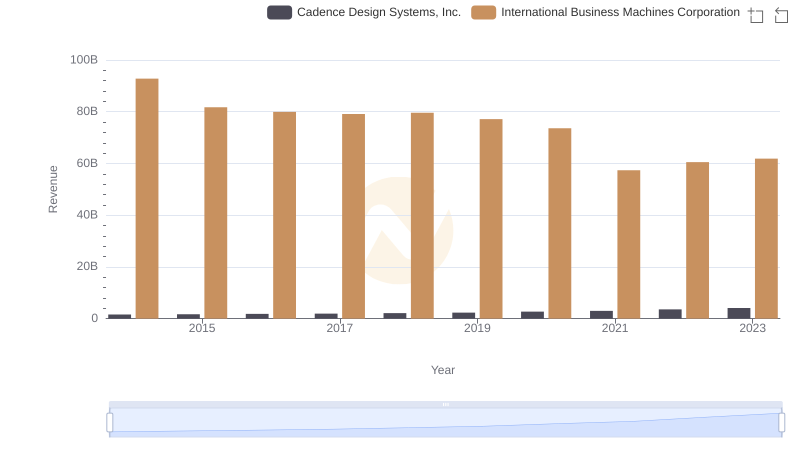
International Business Machines Corporation or Cadence Design Systems, Inc.: Who Leads in Yearly Revenue?
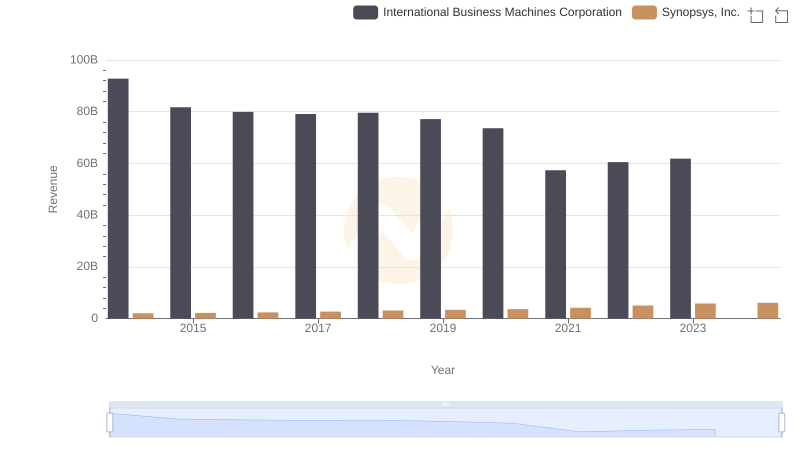
International Business Machines Corporation vs Synopsys, Inc.: Annual Revenue Growth Compared
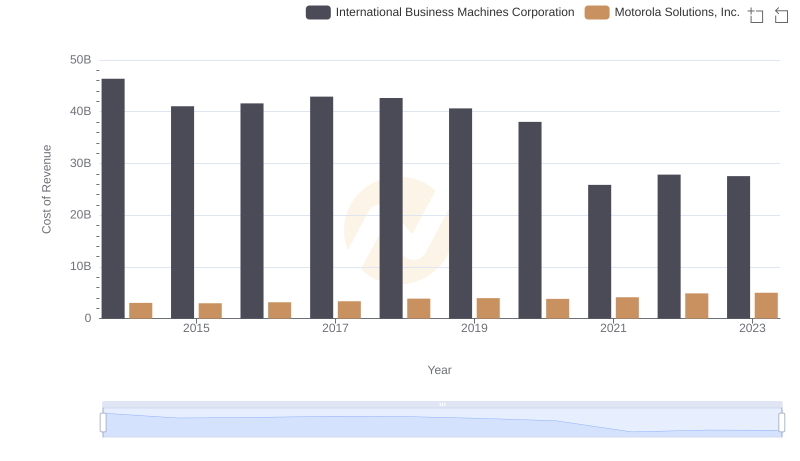
Analyzing Cost of Revenue: International Business Machines Corporation and Motorola Solutions, Inc.
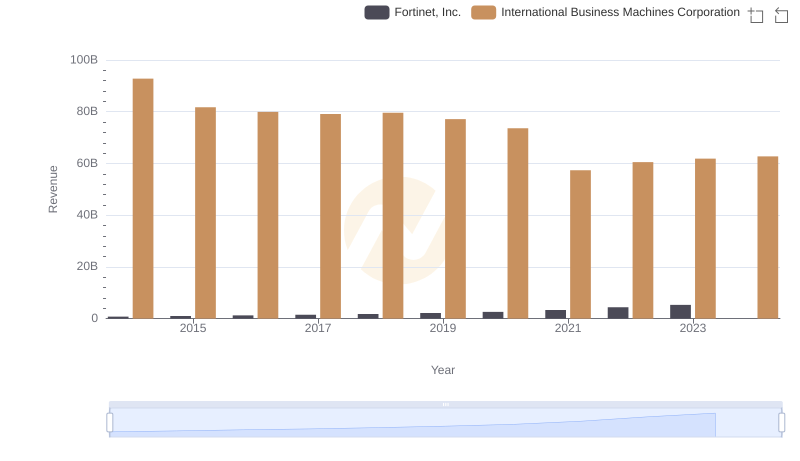
Revenue Insights: International Business Machines Corporation and Fortinet, Inc. Performance Compared
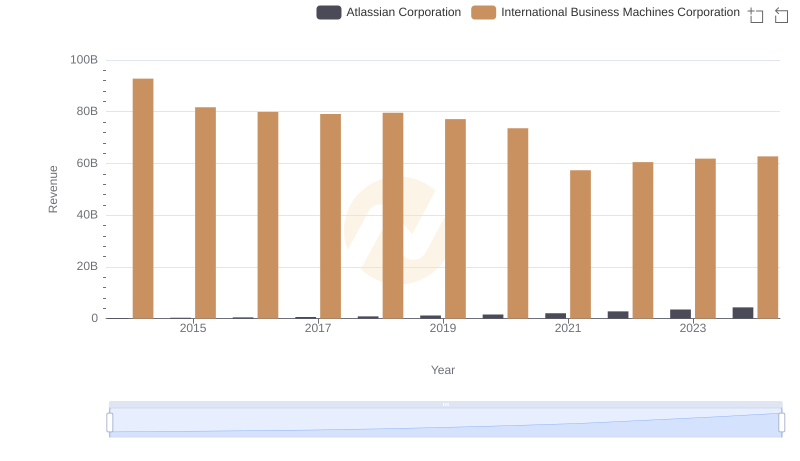
International Business Machines Corporation and Atlassian Corporation: A Comprehensive Revenue Analysis
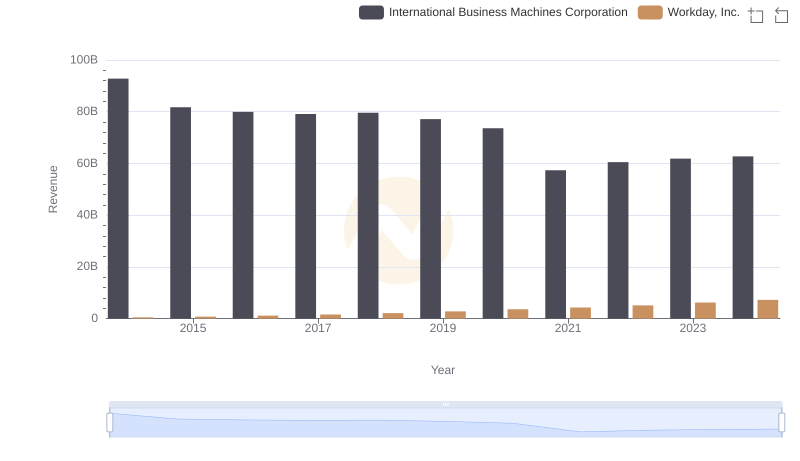
Revenue Insights: International Business Machines Corporation and Workday, Inc. Performance Compared
Breaking Down Revenue Trends: International Business Machines Corporation vs Autodesk, Inc.
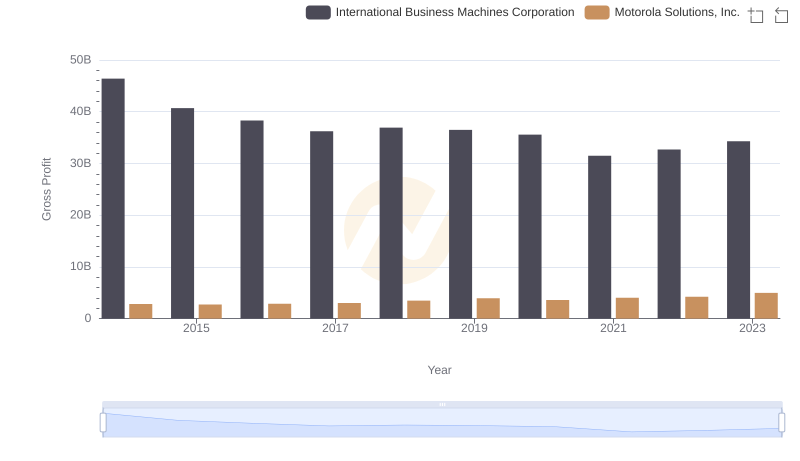
Gross Profit Trends Compared: International Business Machines Corporation vs Motorola Solutions, Inc.
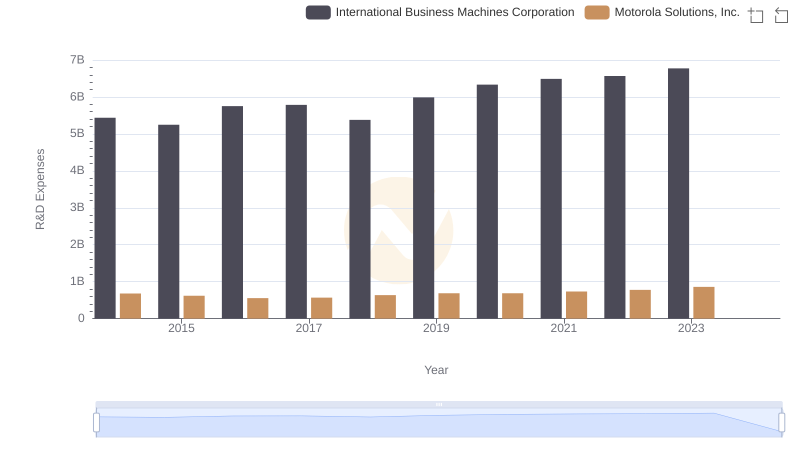
Comparing Innovation Spending: International Business Machines Corporation and Motorola Solutions, Inc.
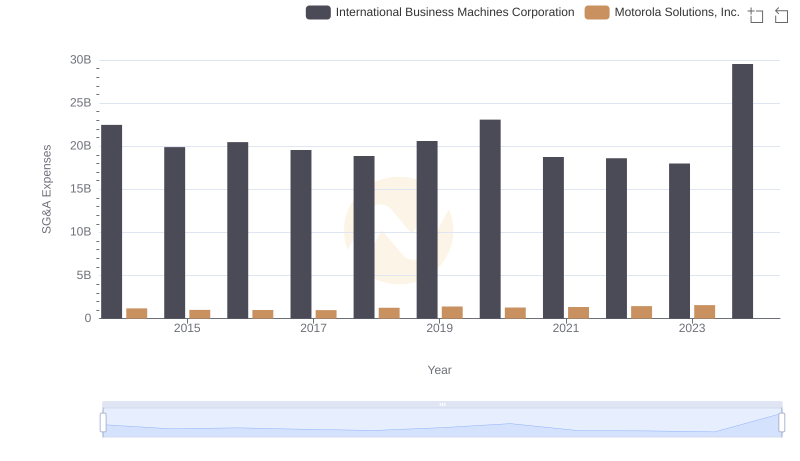
Cost Management Insights: SG&A Expenses for International Business Machines Corporation and Motorola Solutions, Inc.