| __timestamp | International Business Machines Corporation | Marvell Technology, Inc. |
|---|---|---|
| Wednesday, January 1, 2014 | 5437000000 | 1156885000 |
| Thursday, January 1, 2015 | 5247000000 | 1164059000 |
| Friday, January 1, 2016 | 5726000000 | 1101446000 |
| Sunday, January 1, 2017 | 5590000000 | 880050000 |
| Monday, January 1, 2018 | 5379000000 | 714444000 |
| Tuesday, January 1, 2019 | 5910000000 | 914009000 |
| Wednesday, January 1, 2020 | 6262000000 | 1080391000 |
| Friday, January 1, 2021 | 6488000000 | 1072740000 |
| Saturday, January 1, 2022 | 6567000000 | 1424306000 |
| Sunday, January 1, 2023 | 6775000000 | 1784300000 |
| Monday, January 1, 2024 | 0 | 1896200000 |
Igniting the spark of knowledge
In the ever-evolving tech landscape, innovation is the key to staying ahead. This analysis delves into the R&D spending trends of two tech giants: International Business Machines Corporation (IBM) and Marvell Technology, Inc., from 2014 to 2023. IBM, a stalwart in the industry, consistently allocated a significant portion of its resources to research and development, peaking in 2023 with a 25% increase from 2014. Meanwhile, Marvell Technology, a leader in semiconductor solutions, demonstrated a remarkable growth trajectory, with its R&D spending surging by over 54% during the same period. Notably, 2024 data for IBM is missing, indicating a potential shift or reporting delay. This comparison highlights the strategic emphasis both companies place on innovation, albeit with different growth patterns, reflecting their unique market positions and future aspirations.
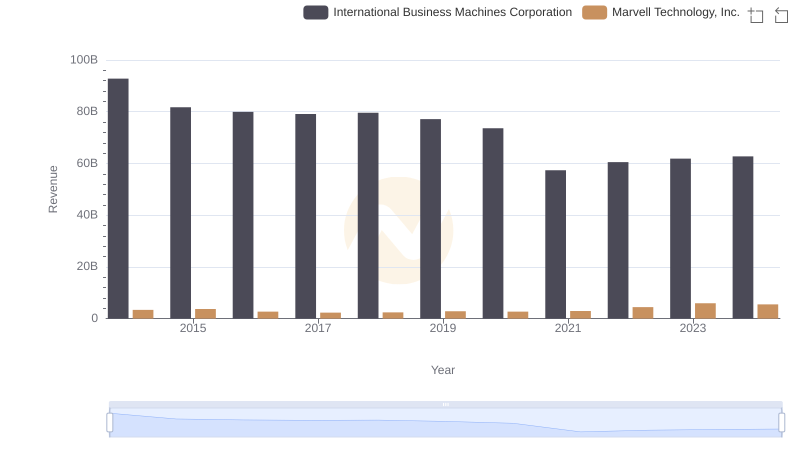
International Business Machines Corporation vs Marvell Technology, Inc.: Annual Revenue Growth Compared
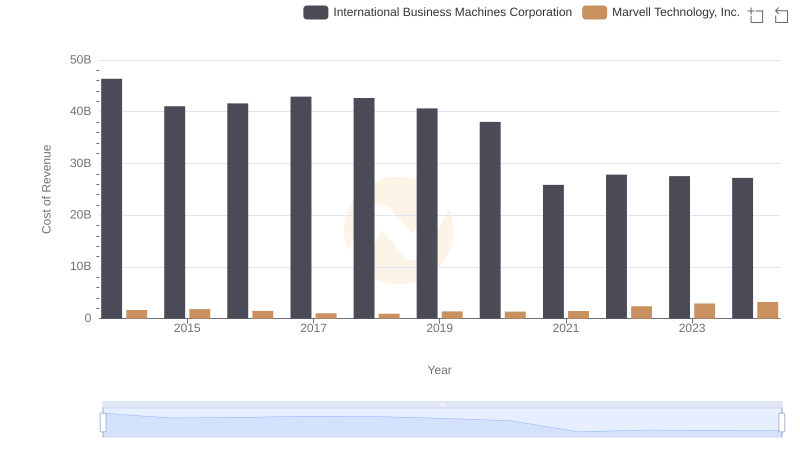
Cost Insights: Breaking Down International Business Machines Corporation and Marvell Technology, Inc.'s Expenses
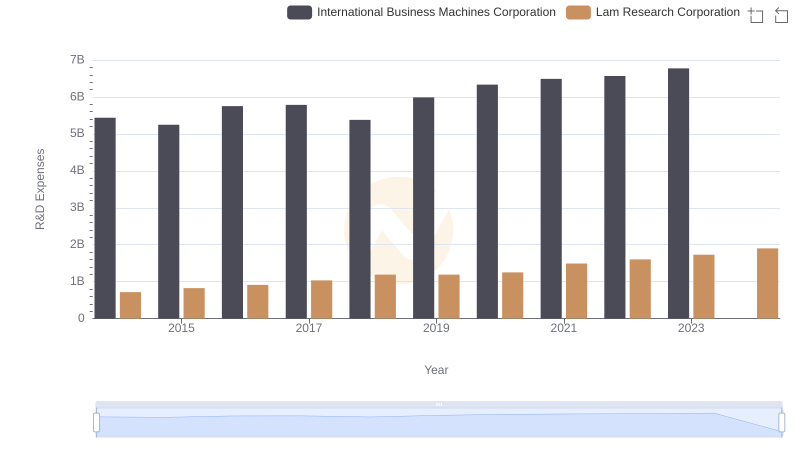
Research and Development Expenses Breakdown: International Business Machines Corporation vs Lam Research Corporation
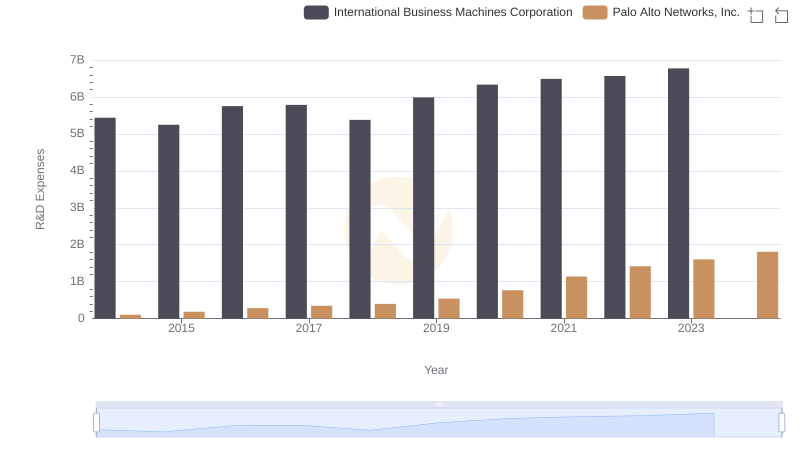
Analyzing R&D Budgets: International Business Machines Corporation vs Palo Alto Networks, Inc.
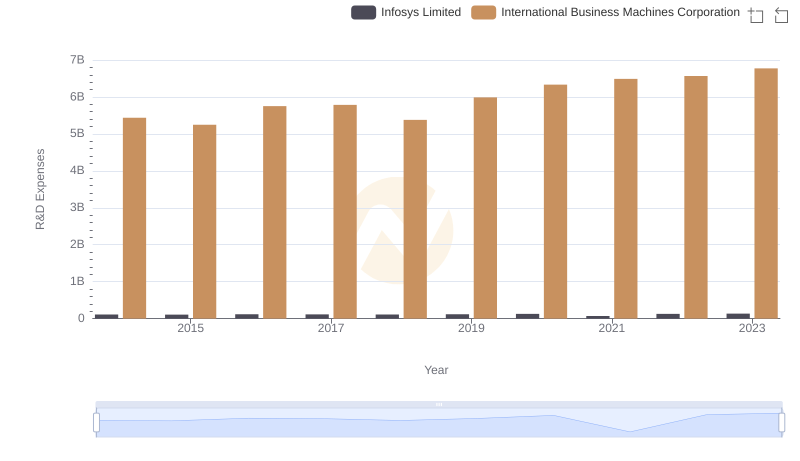
Analyzing R&D Budgets: International Business Machines Corporation vs Infosys Limited

Gross Profit Trends Compared: International Business Machines Corporation vs Marvell Technology, Inc.
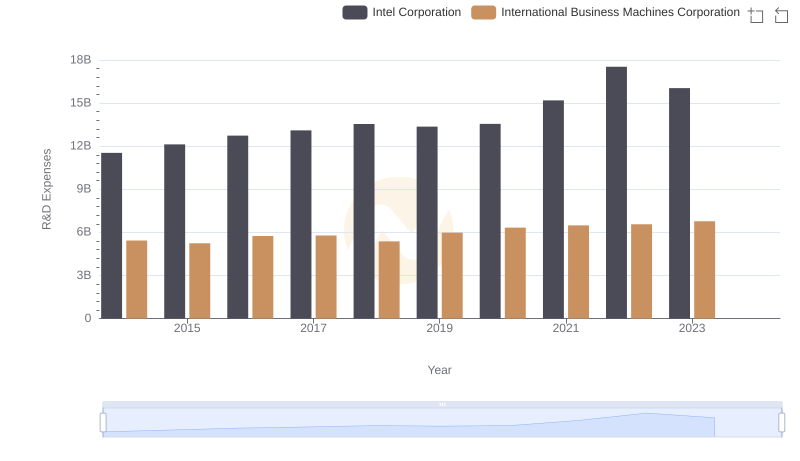
R&D Spending Showdown: International Business Machines Corporation vs Intel Corporation
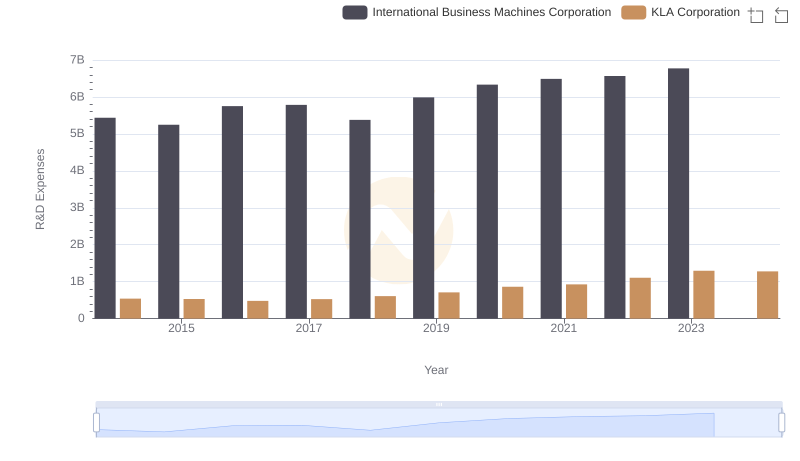
Analyzing R&D Budgets: International Business Machines Corporation vs KLA Corporation
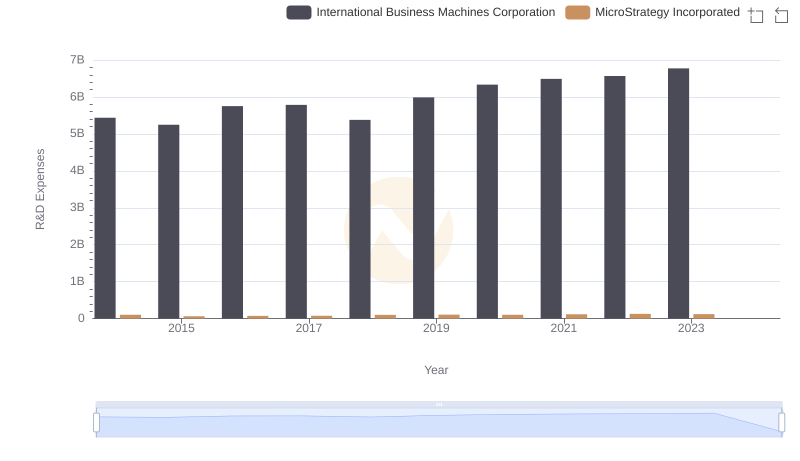
R&D Spending Showdown: International Business Machines Corporation vs MicroStrategy Incorporated
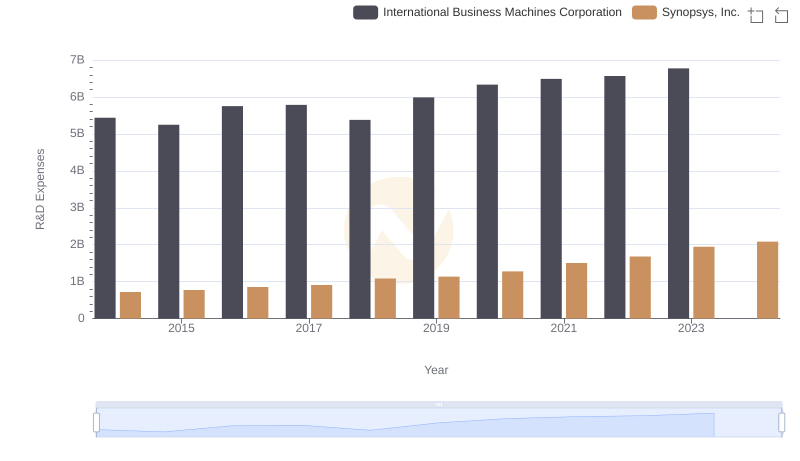
Who Prioritizes Innovation? R&D Spending Compared for International Business Machines Corporation and Synopsys, Inc.
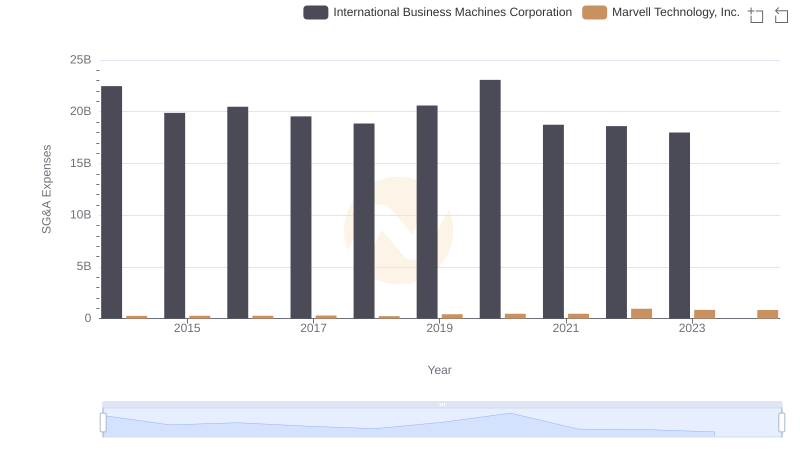
SG&A Efficiency Analysis: Comparing International Business Machines Corporation and Marvell Technology, Inc.
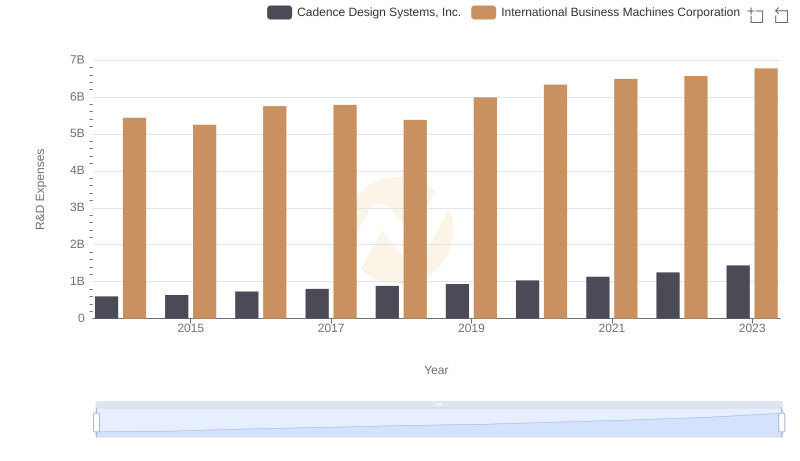
International Business Machines Corporation or Cadence Design Systems, Inc.: Who Invests More in Innovation?