| __timestamp | International Business Machines Corporation | Marvell Technology, Inc. |
|---|---|---|
| Wednesday, January 1, 2014 | 92793000000 | 3404400000 |
| Thursday, January 1, 2015 | 81742000000 | 3706963000 |
| Friday, January 1, 2016 | 79920000000 | 2725828000 |
| Sunday, January 1, 2017 | 79139000000 | 2317674000 |
| Monday, January 1, 2018 | 79591000000 | 2409170000 |
| Tuesday, January 1, 2019 | 57714000000 | 2865791000 |
| Wednesday, January 1, 2020 | 55179000000 | 2699161000 |
| Friday, January 1, 2021 | 57351000000 | 2968900000 |
| Saturday, January 1, 2022 | 60530000000 | 4462383000 |
| Sunday, January 1, 2023 | 61860000000 | 5919600000 |
| Monday, January 1, 2024 | 62753000000 | 5507700000 |
Igniting the spark of knowledge
In the ever-evolving tech landscape, International Business Machines Corporation (IBM) and Marvell Technology, Inc. have charted distinct paths over the past decade. From 2014 to 2024, IBM's annual revenue has seen a decline of approximately 32%, dropping from its peak in 2014. This reflects the company's strategic pivot from traditional hardware to cloud computing and AI services. Meanwhile, Marvell Technology has experienced a robust growth trajectory, with its revenue surging by over 60% during the same period. This growth underscores Marvell's successful expansion into data infrastructure and 5G technology. By 2023, Marvell's revenue reached nearly $6 billion, showcasing its resilience and adaptability in a competitive market. As these two giants continue to innovate, their financial narratives offer a fascinating glimpse into the broader trends shaping the tech industry.
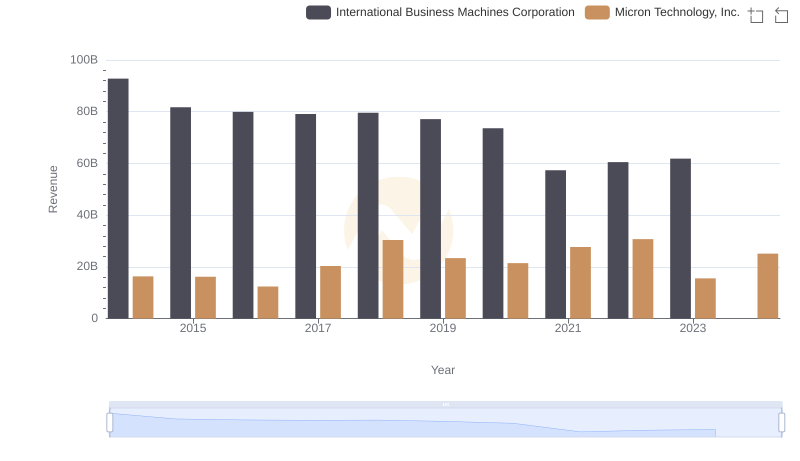
International Business Machines Corporation vs Micron Technology, Inc.: Examining Key Revenue Metrics
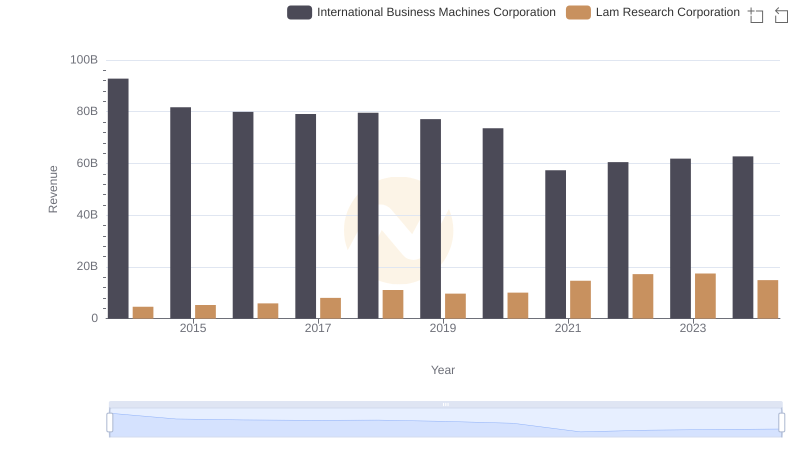
International Business Machines Corporation or Lam Research Corporation: Who Leads in Yearly Revenue?
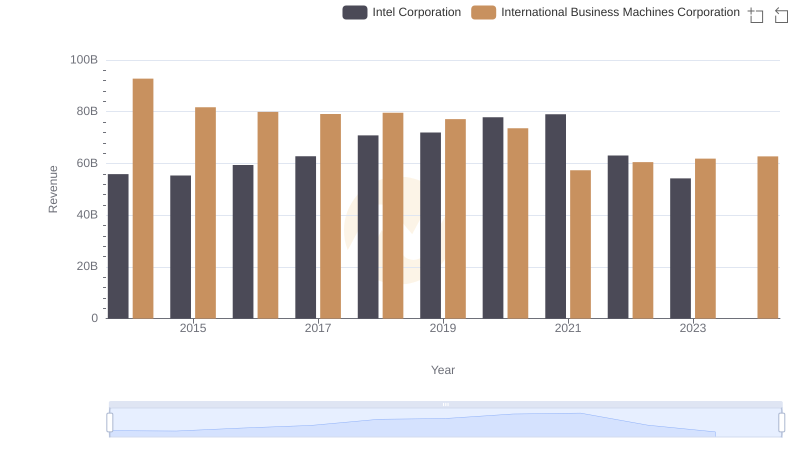
International Business Machines Corporation or Intel Corporation: Who Leads in Yearly Revenue?
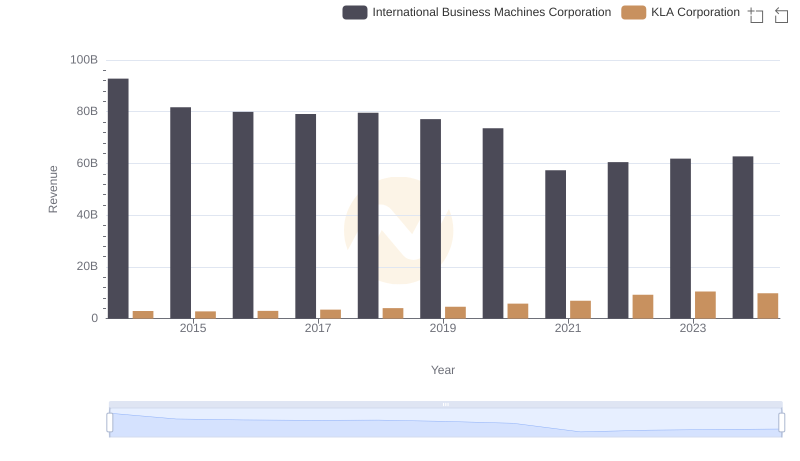
Breaking Down Revenue Trends: International Business Machines Corporation vs KLA Corporation
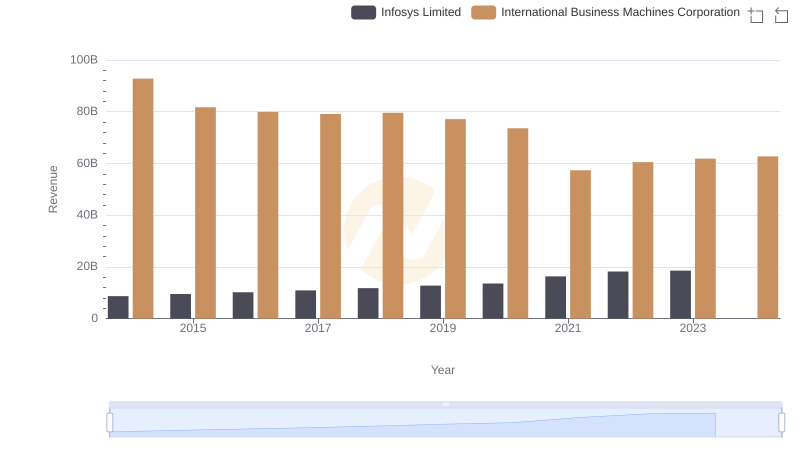
Revenue Insights: International Business Machines Corporation and Infosys Limited Performance Compared
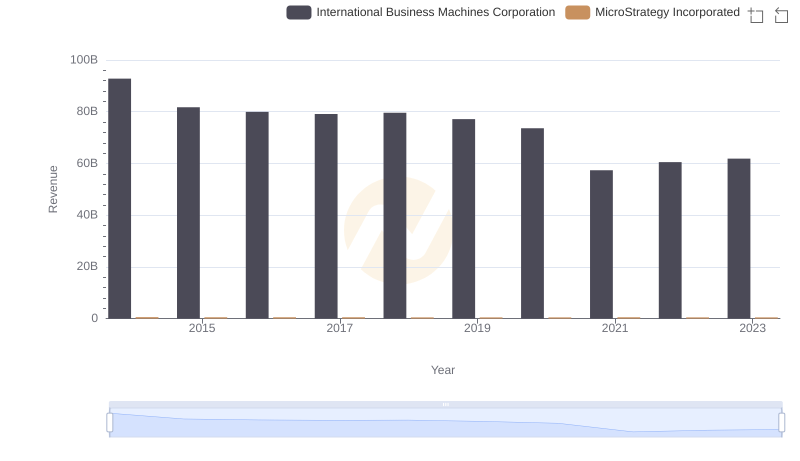
Revenue Insights: International Business Machines Corporation and MicroStrategy Incorporated Performance Compared
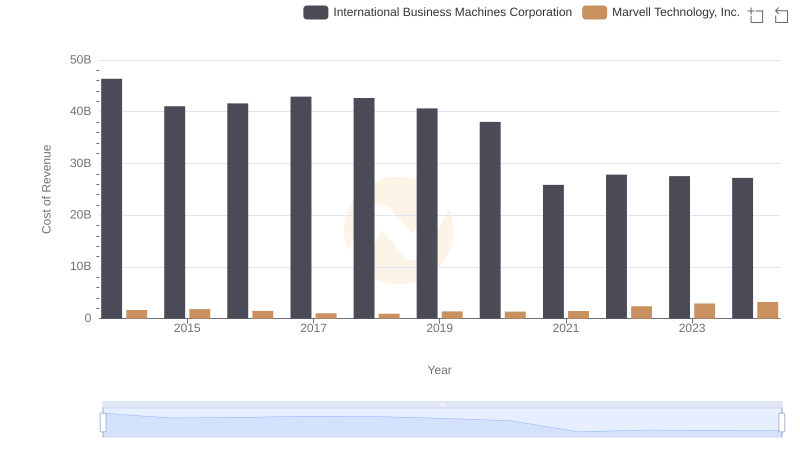
Cost Insights: Breaking Down International Business Machines Corporation and Marvell Technology, Inc.'s Expenses
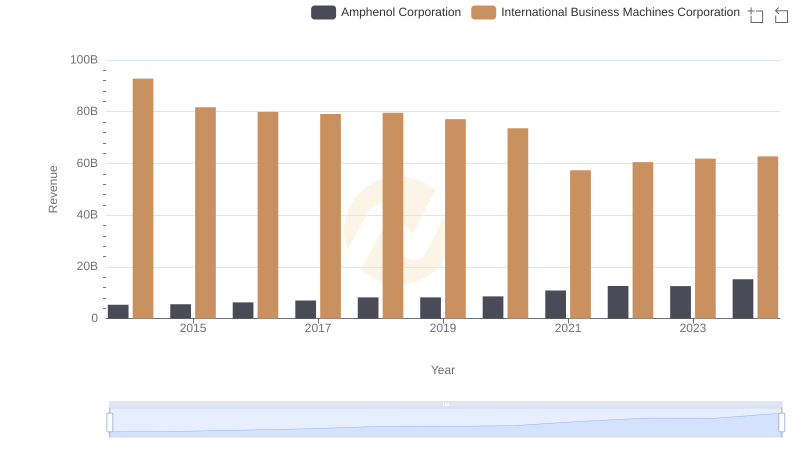
Revenue Insights: International Business Machines Corporation and Amphenol Corporation Performance Compared
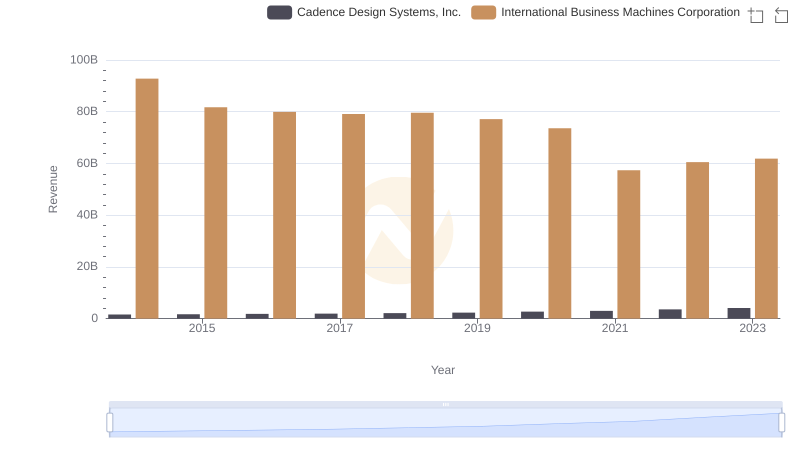
International Business Machines Corporation or Cadence Design Systems, Inc.: Who Leads in Yearly Revenue?

Gross Profit Trends Compared: International Business Machines Corporation vs Marvell Technology, Inc.
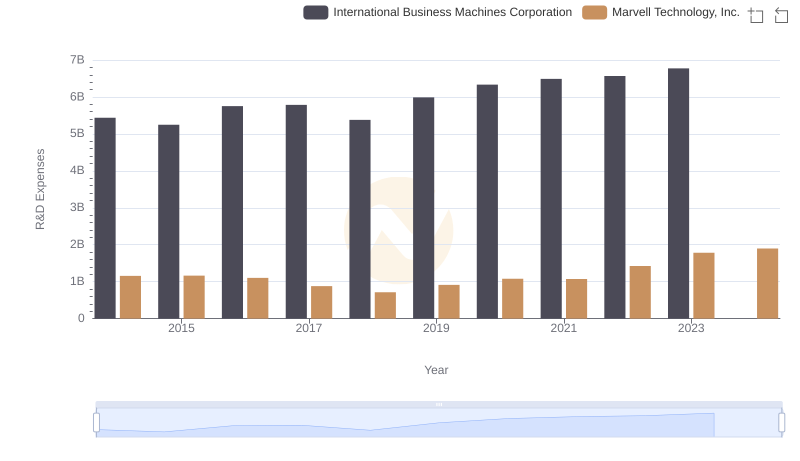
Who Prioritizes Innovation? R&D Spending Compared for International Business Machines Corporation and Marvell Technology, Inc.
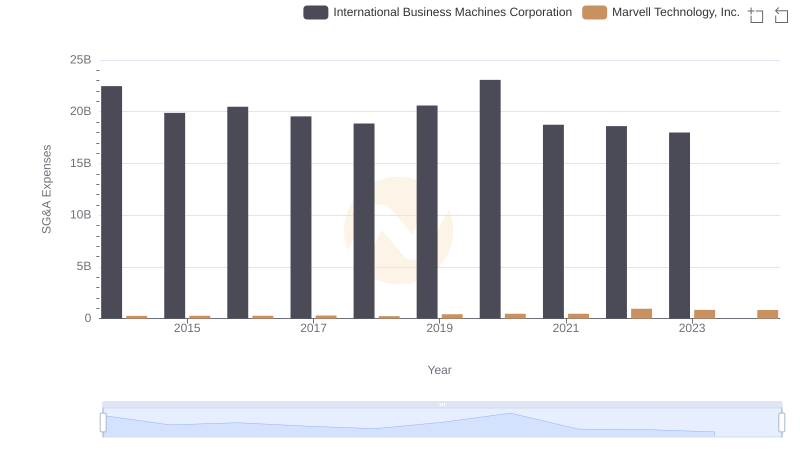
SG&A Efficiency Analysis: Comparing International Business Machines Corporation and Marvell Technology, Inc.