| __timestamp | 3M Company | Watsco, Inc. |
|---|---|---|
| Wednesday, January 1, 2014 | 15374000000 | 956402000 |
| Thursday, January 1, 2015 | 14891000000 | 1007357000 |
| Friday, January 1, 2016 | 15069000000 | 1034584000 |
| Sunday, January 1, 2017 | 15656000000 | 1065659000 |
| Monday, January 1, 2018 | 16083000000 | 1120252000 |
| Tuesday, January 1, 2019 | 15000000000 | 1156956000 |
| Wednesday, January 1, 2020 | 15579000000 | 1222821000 |
| Friday, January 1, 2021 | 16560000000 | 1667545000 |
| Saturday, January 1, 2022 | 14997000000 | 2030289000 |
| Sunday, January 1, 2023 | 14204000000 | 1992140000 |
| Monday, January 1, 2024 | 10128000000 | 2044713000 |
Unleashing insights
In the ever-evolving landscape of American industry, the financial trajectories of 3M Company and Watsco, Inc. offer a fascinating study in contrasts. Over the past decade, 3M's gross profit has shown a steady, albeit fluctuating, trend. From 2014 to 2023, 3M's gross profit peaked in 2021, marking a 7% increase from 2014, before experiencing a decline in 2023. Meanwhile, Watsco, Inc., a leader in HVAC distribution, has demonstrated remarkable growth. From 2014 to 2023, Watsco's gross profit surged by over 100%, reflecting its strategic market expansion and robust demand for climate control solutions. Notably, 2024 data for Watsco is missing, leaving room for speculation on its future performance. This comparison underscores the dynamic nature of the industrial and distribution sectors, where innovation and market adaptation are key to financial success.
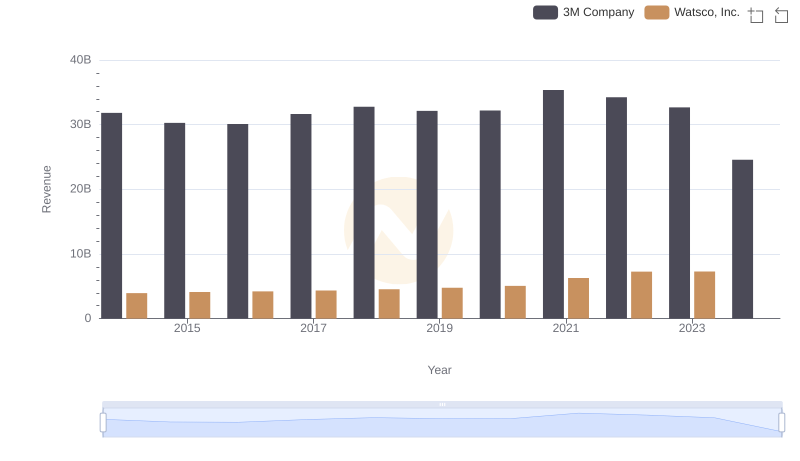
3M Company and Watsco, Inc.: A Comprehensive Revenue Analysis
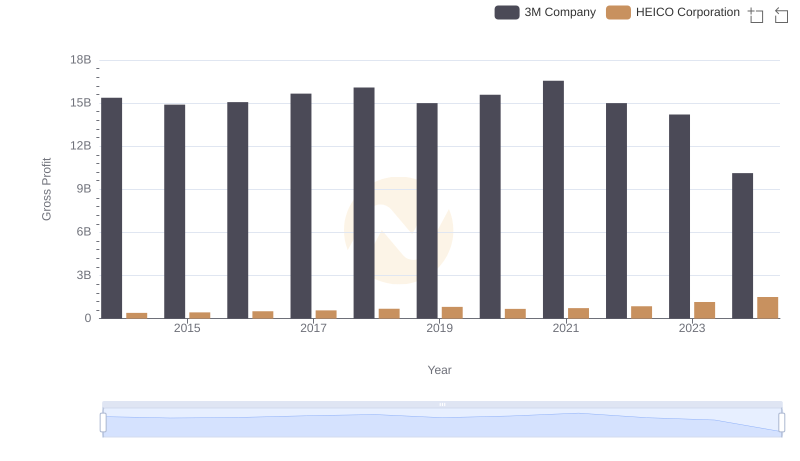
Key Insights on Gross Profit: 3M Company vs HEICO Corporation
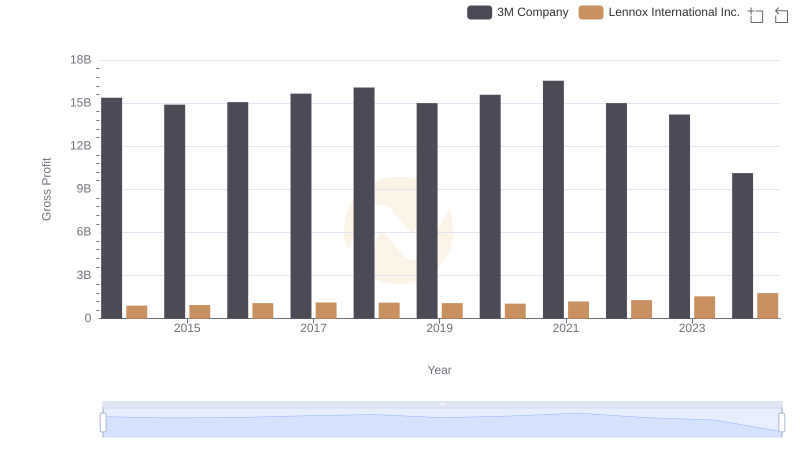
Who Generates Higher Gross Profit? 3M Company or Lennox International Inc.

Cost of Revenue Trends: 3M Company vs Watsco, Inc.
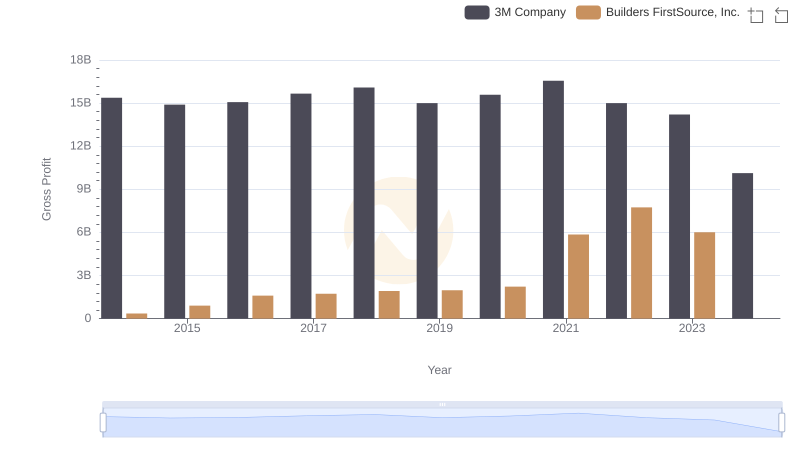
3M Company vs Builders FirstSource, Inc.: A Gross Profit Performance Breakdown
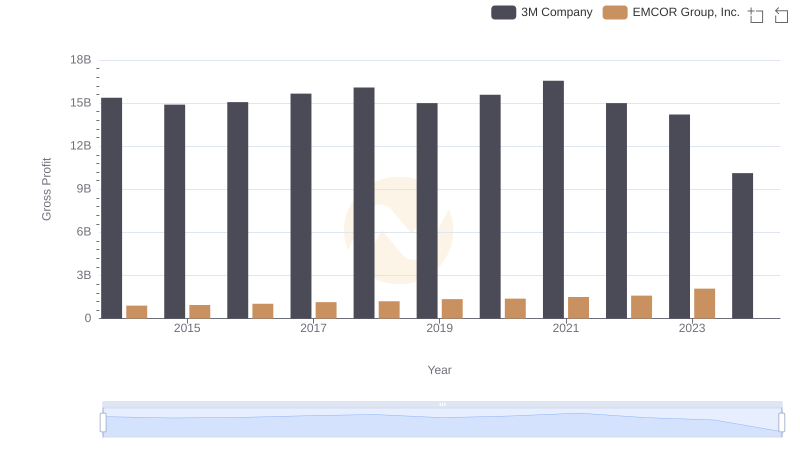
Who Generates Higher Gross Profit? 3M Company or EMCOR Group, Inc.
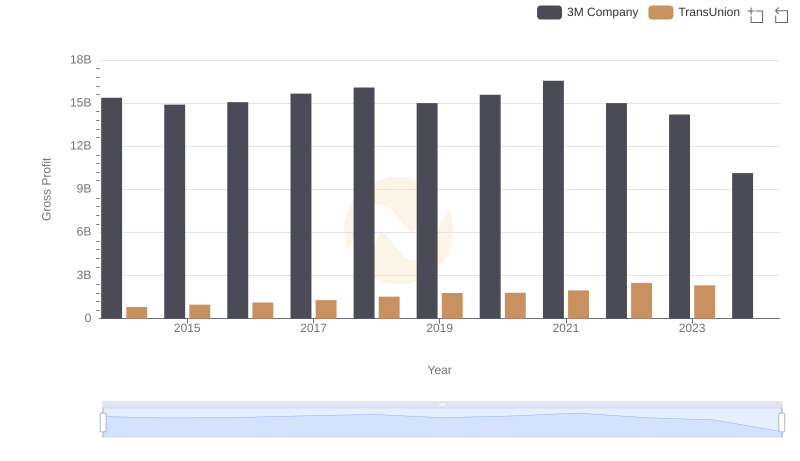
3M Company and TransUnion: A Detailed Gross Profit Analysis
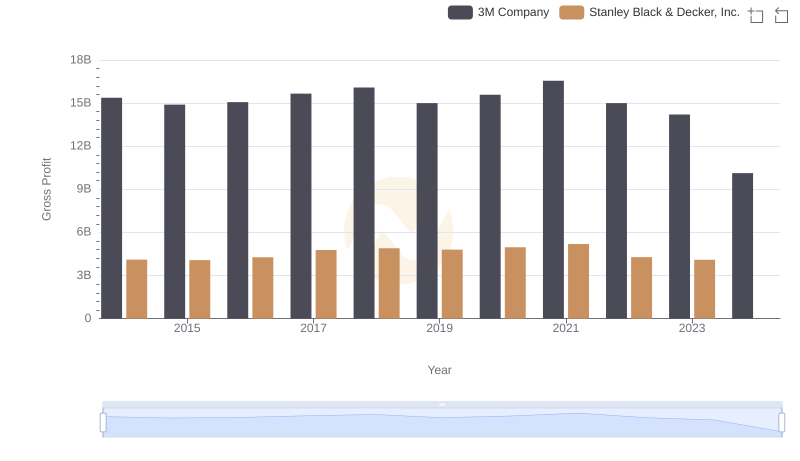
Gross Profit Trends Compared: 3M Company vs Stanley Black & Decker, Inc.