| __timestamp | 3M Company | Lennox International Inc. |
|---|---|---|
| Wednesday, January 1, 2014 | 15374000000 | 903300000 |
| Thursday, January 1, 2015 | 14891000000 | 947400000 |
| Friday, January 1, 2016 | 15069000000 | 1076500000 |
| Sunday, January 1, 2017 | 15656000000 | 1125200000 |
| Monday, January 1, 2018 | 16083000000 | 1111200000 |
| Tuesday, January 1, 2019 | 15000000000 | 1079800000 |
| Wednesday, January 1, 2020 | 15579000000 | 1040100000 |
| Friday, January 1, 2021 | 16560000000 | 1188400000 |
| Saturday, January 1, 2022 | 14997000000 | 1284700000 |
| Sunday, January 1, 2023 | 14204000000 | 1547800000 |
| Monday, January 1, 2024 | 10128000000 | 1771900000 |
In pursuit of knowledge
In the world of industrial giants, the battle for supremacy often boils down to financial prowess. Over the past decade, 3M Company has consistently outperformed Lennox International Inc. in terms of gross profit. From 2014 to 2023, 3M's gross profit averaged around $14.9 billion annually, dwarfing Lennox's $1.2 billion. However, the tides are shifting. By 2023, Lennox's gross profit surged by 72% compared to 2014, reaching $1.55 billion, while 3M saw a decline of 8% from its peak in 2021. This trend suggests a narrowing gap, with Lennox gaining momentum. As we look to 2024, Lennox's projected gross profit of $1.77 billion marks a significant milestone, challenging 3M's dominance. This evolving narrative highlights the dynamic nature of the industrial sector, where strategic shifts and market adaptations can redefine the competitive landscape.
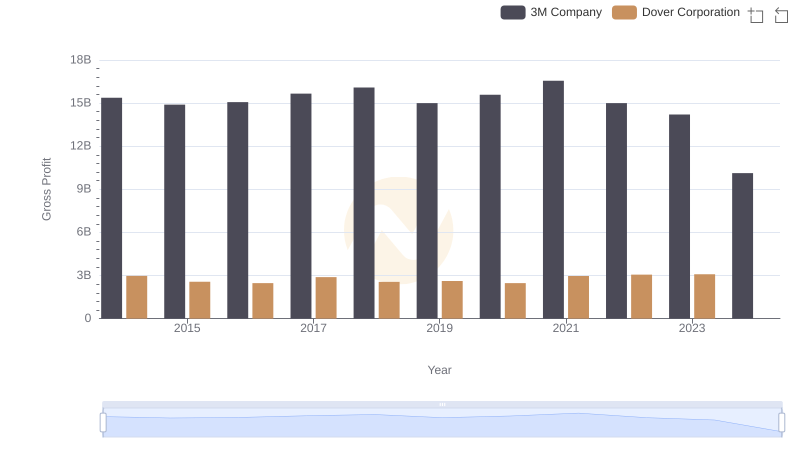
Gross Profit Comparison: 3M Company and Dover Corporation Trends
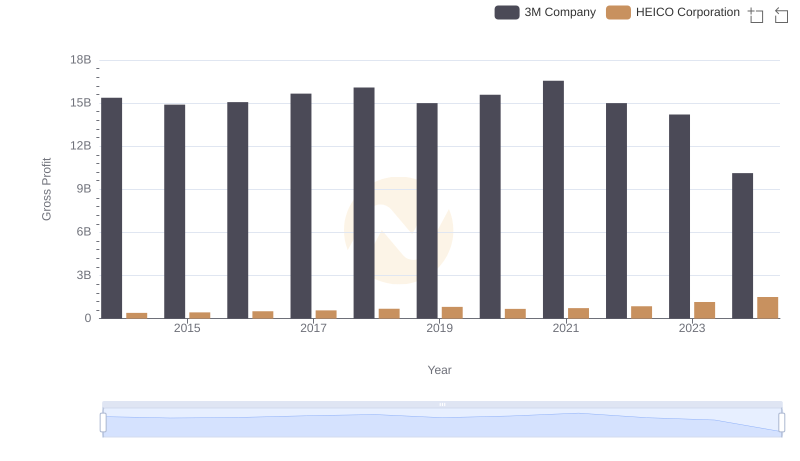
Key Insights on Gross Profit: 3M Company vs HEICO Corporation
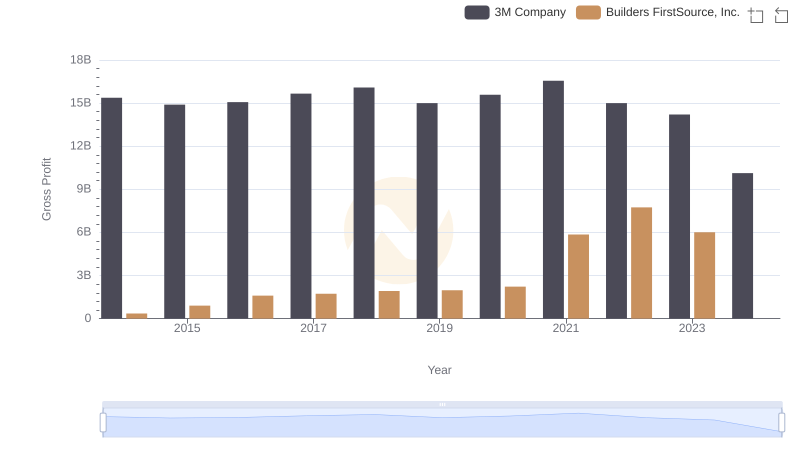
3M Company vs Builders FirstSource, Inc.: A Gross Profit Performance Breakdown
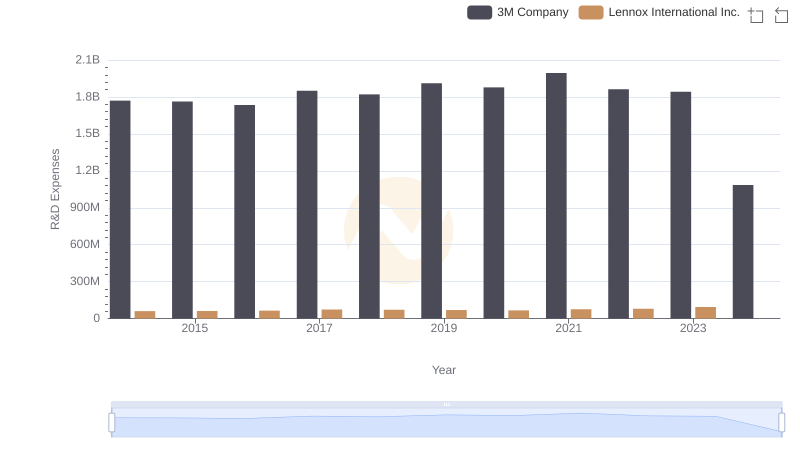
Research and Development Investment: 3M Company vs Lennox International Inc.
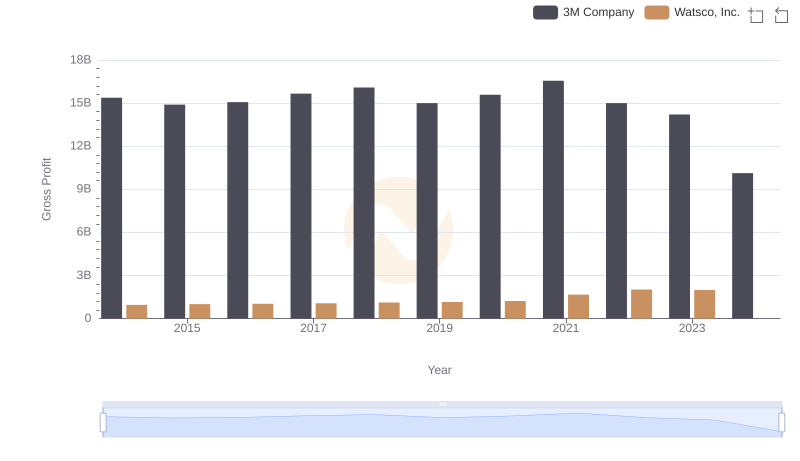
Gross Profit Trends Compared: 3M Company vs Watsco, Inc.
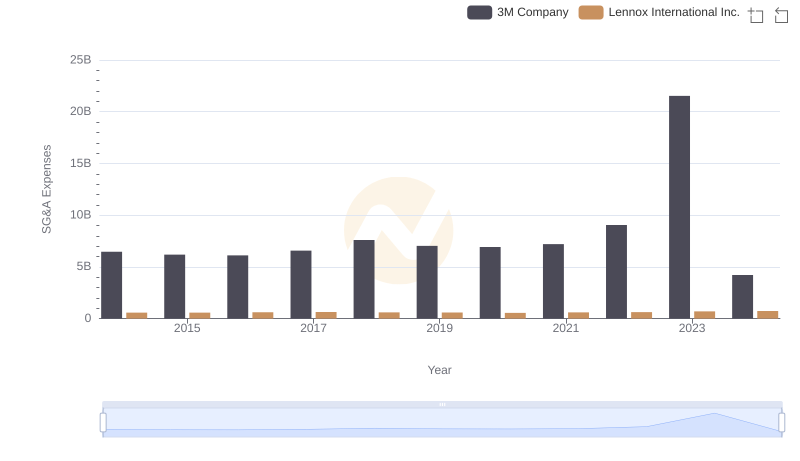
3M Company and Lennox International Inc.: SG&A Spending Patterns Compared