| __timestamp | 3M Company | EMCOR Group, Inc. |
|---|---|---|
| Wednesday, January 1, 2014 | 15374000000 | 907246000 |
| Thursday, January 1, 2015 | 14891000000 | 944479000 |
| Friday, January 1, 2016 | 15069000000 | 1037862000 |
| Sunday, January 1, 2017 | 15656000000 | 1147012000 |
| Monday, January 1, 2018 | 16083000000 | 1205453000 |
| Tuesday, January 1, 2019 | 15000000000 | 1355868000 |
| Wednesday, January 1, 2020 | 15579000000 | 1395382000 |
| Friday, January 1, 2021 | 16560000000 | 1501737000 |
| Saturday, January 1, 2022 | 14997000000 | 1603594000 |
| Sunday, January 1, 2023 | 14204000000 | 2089339000 |
| Monday, January 1, 2024 | 10128000000 |
Unleashing the power of data
In the world of industrial giants, the battle for supremacy often boils down to who can generate the most profit. From 2014 to 2023, 3M Company consistently outperformed EMCOR Group, Inc. in terms of gross profit. However, the gap has been narrowing. In 2014, 3M's gross profit was nearly 17 times that of EMCOR. Fast forward to 2023, and EMCOR's gross profit surged by over 130%, while 3M saw a decline of about 8%. This shift highlights EMCOR's impressive growth trajectory, even as 3M remains a formidable player. The data for 2024 is incomplete, but the trend suggests a dynamic competition. As these companies continue to evolve, investors and industry watchers should keep a close eye on their strategies and market adaptations.
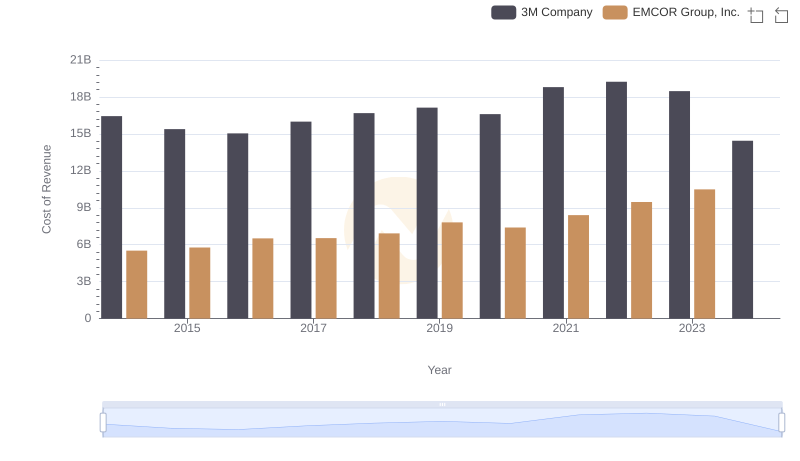
3M Company vs EMCOR Group, Inc.: Efficiency in Cost of Revenue Explored
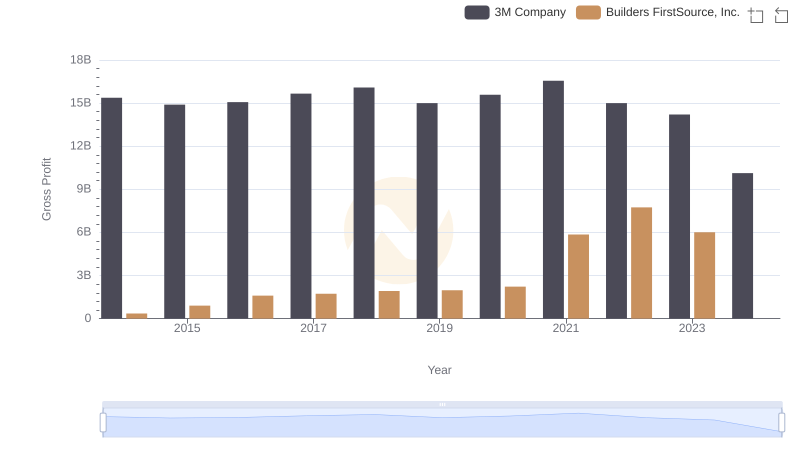
3M Company vs Builders FirstSource, Inc.: A Gross Profit Performance Breakdown

Gross Profit Trends Compared: 3M Company vs Watsco, Inc.
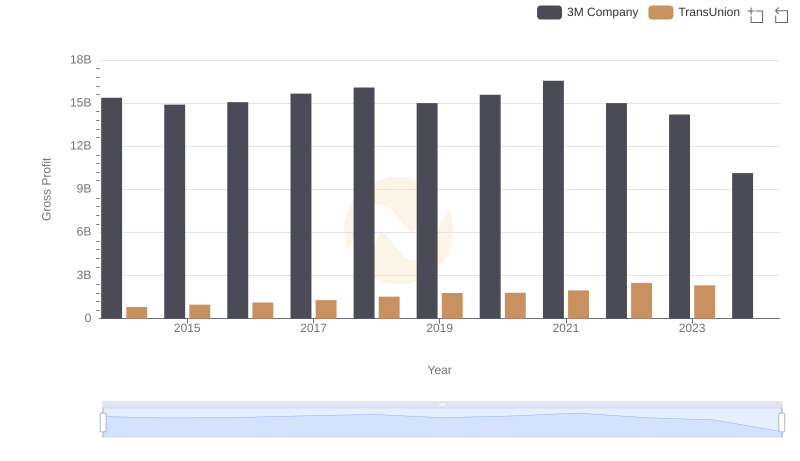
3M Company and TransUnion: A Detailed Gross Profit Analysis
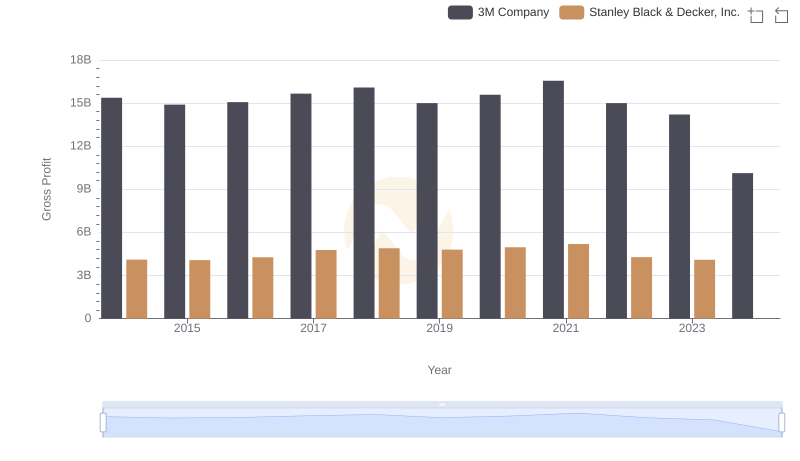
Gross Profit Trends Compared: 3M Company vs Stanley Black & Decker, Inc.
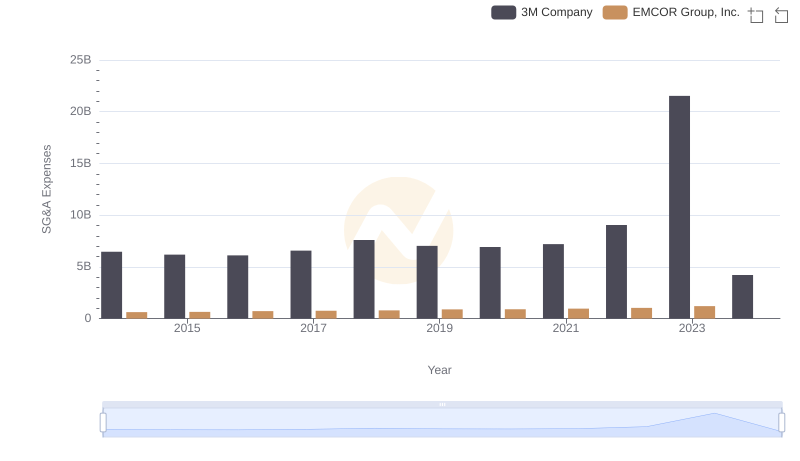
Who Optimizes SG&A Costs Better? 3M Company or EMCOR Group, Inc.