| __timestamp | 3M Company | Builders FirstSource, Inc. |
|---|---|---|
| Wednesday, January 1, 2014 | 15374000000 | 356997000 |
| Thursday, January 1, 2015 | 14891000000 | 901458000 |
| Friday, January 1, 2016 | 15069000000 | 1596748000 |
| Sunday, January 1, 2017 | 15656000000 | 1727391000 |
| Monday, January 1, 2018 | 16083000000 | 1922940000 |
| Tuesday, January 1, 2019 | 15000000000 | 1976829000 |
| Wednesday, January 1, 2020 | 15579000000 | 2222584000 |
| Friday, January 1, 2021 | 16560000000 | 5850956000 |
| Saturday, January 1, 2022 | 14997000000 | 7744379000 |
| Sunday, January 1, 2023 | 14204000000 | 6012334000 |
| Monday, January 1, 2024 | 10128000000 |
Infusing magic into the data realm
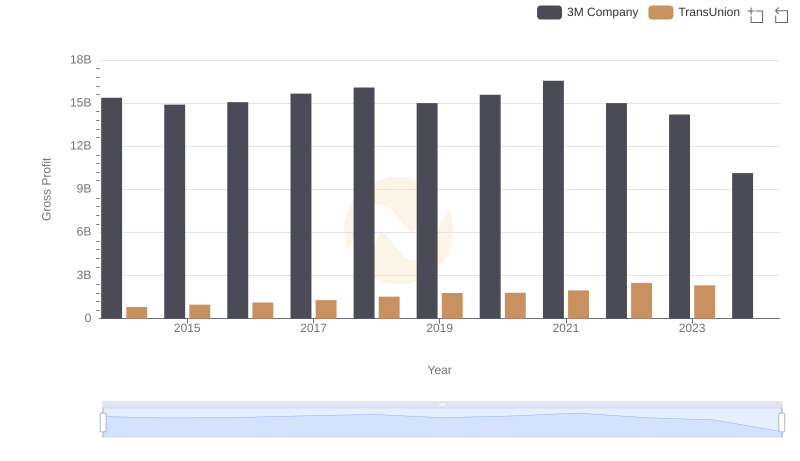
In the ever-evolving landscape of the American stock market, the gross profit performance of 3M Company and Builders FirstSource, Inc. offers a fascinating study in contrasts. Over the past decade, 3M Company, a stalwart in the industrial sector, has seen its gross profit fluctuate, peaking in 2021 with a 10% increase from 2014. However, by 2023, it experienced a decline of approximately 14% from its 2021 high.
Conversely, Builders FirstSource, Inc., a key player in the construction industry, has demonstrated remarkable growth. From a modest start in 2014, its gross profit surged by over 2000% by 2022, reflecting the booming demand in the housing market. Despite a slight dip in 2023, the company's trajectory remains impressive.
This data underscores the dynamic nature of industry-specific growth and the resilience of companies in adapting to market demands.
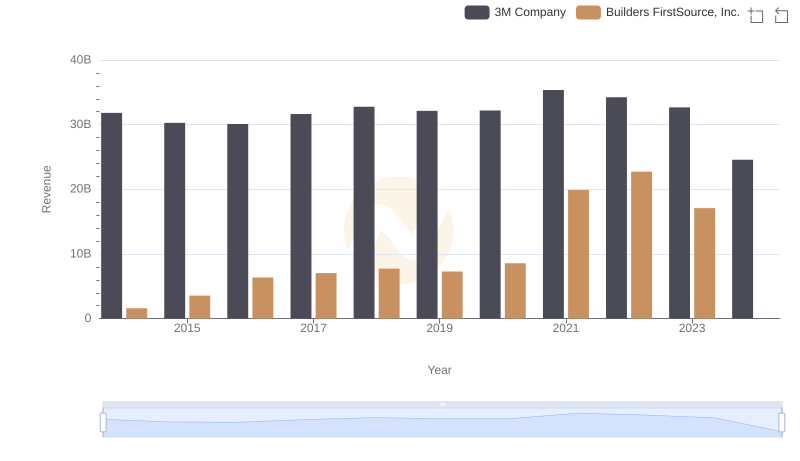
Breaking Down Revenue Trends: 3M Company vs Builders FirstSource, Inc.
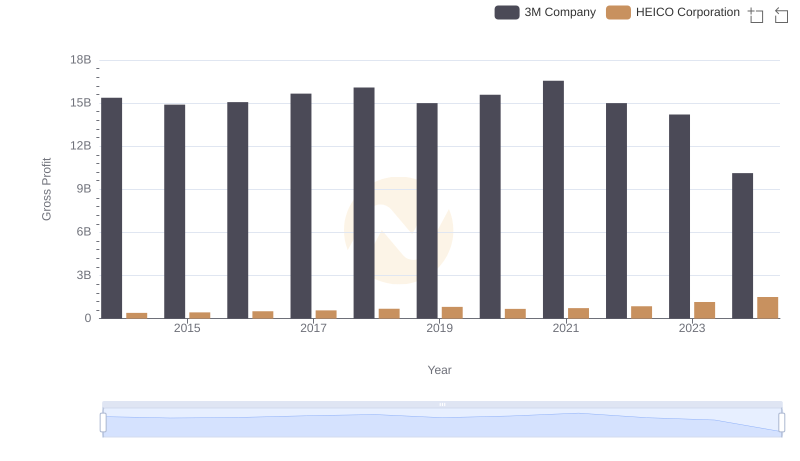
Key Insights on Gross Profit: 3M Company vs HEICO Corporation
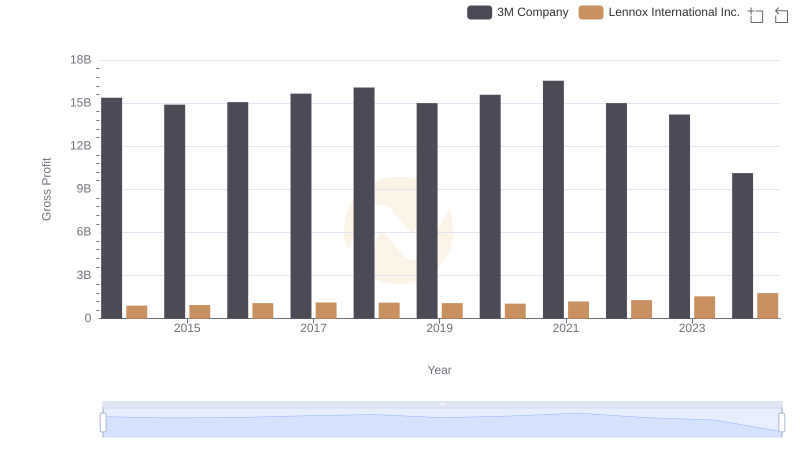
Who Generates Higher Gross Profit? 3M Company or Lennox International Inc.

Gross Profit Trends Compared: 3M Company vs Watsco, Inc.
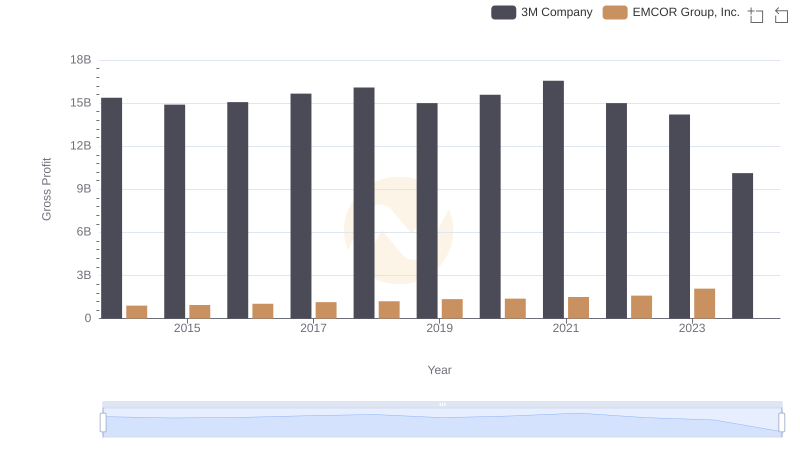
Who Generates Higher Gross Profit? 3M Company or EMCOR Group, Inc.
3M Company and TransUnion: A Detailed Gross Profit Analysis