| __timestamp | 3M Company | HEICO Corporation |
|---|---|---|
| Wednesday, January 1, 2014 | 15374000000 | 398312000 |
| Thursday, January 1, 2015 | 14891000000 | 434179000 |
| Friday, January 1, 2016 | 15069000000 | 515492000 |
| Sunday, January 1, 2017 | 15656000000 | 574725000 |
| Monday, January 1, 2018 | 16083000000 | 690715000 |
| Tuesday, January 1, 2019 | 15000000000 | 813840000 |
| Wednesday, January 1, 2020 | 15579000000 | 682127000 |
| Friday, January 1, 2021 | 16560000000 | 727423000 |
| Saturday, January 1, 2022 | 14997000000 | 862759000 |
| Sunday, January 1, 2023 | 14204000000 | 1153488000 |
| Monday, January 1, 2024 | 10128000000 | 1501726000 |
Data in motion
In the ever-evolving landscape of industrial giants, 3M Company and HEICO Corporation stand as titans in their respective fields. Over the past decade, from 2014 to 2024, these companies have showcased contrasting trajectories in gross profit. While 3M Company, a stalwart in innovation, saw its gross profit peak in 2021, it experienced a decline of approximately 39% by 2024. In contrast, HEICO Corporation, a leader in aerospace and electronics, demonstrated a remarkable growth trajectory, with its gross profit surging by nearly 277% over the same period.
This divergence highlights the dynamic nature of the industrial sector, where adaptability and strategic foresight are key. As 3M navigates challenges, HEICO's ascent underscores the potential for growth in niche markets. Investors and industry watchers should keep a keen eye on these trends as they shape the future of these industrial powerhouses.
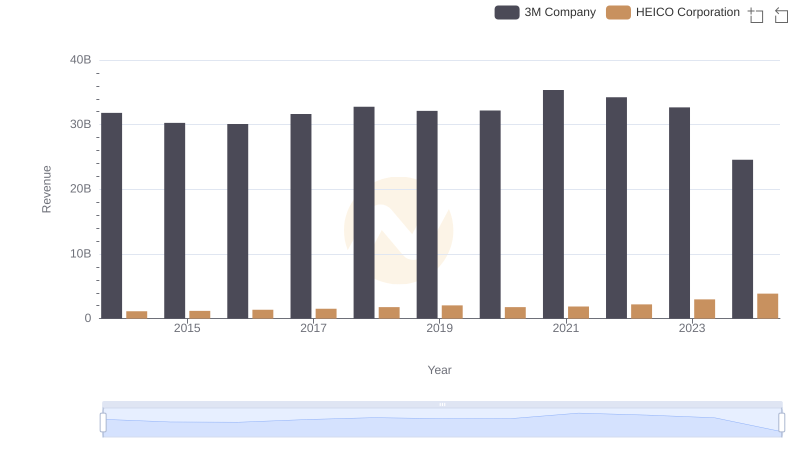
3M Company vs HEICO Corporation: Examining Key Revenue Metrics

Key Insights on Gross Profit: 3M Company vs Equifax Inc.
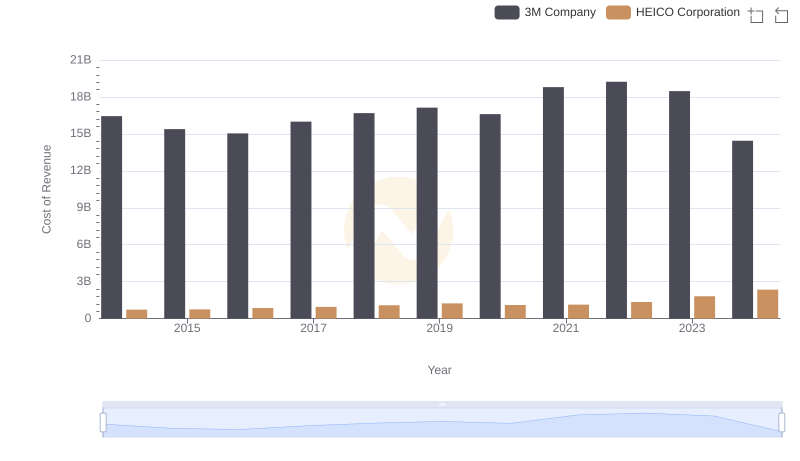
Comparing Cost of Revenue Efficiency: 3M Company vs HEICO Corporation
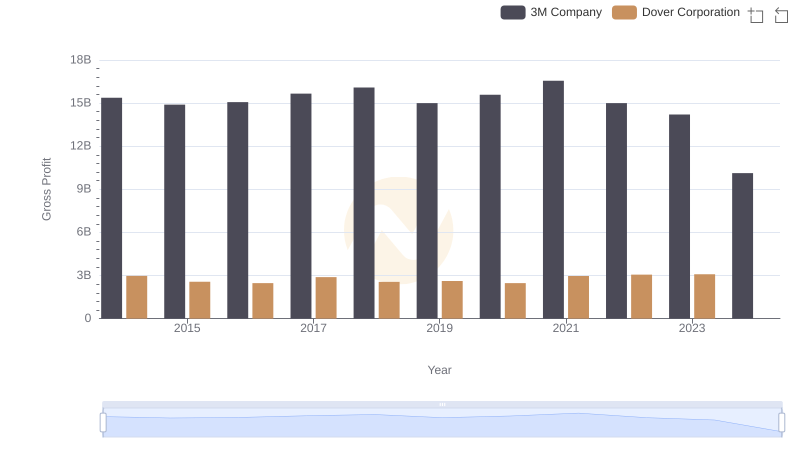
Gross Profit Comparison: 3M Company and Dover Corporation Trends
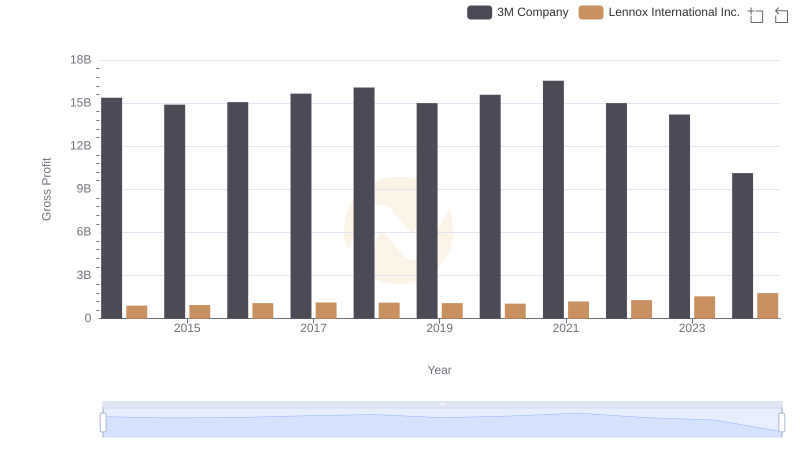
Who Generates Higher Gross Profit? 3M Company or Lennox International Inc.
3M Company vs Builders FirstSource, Inc.: A Gross Profit Performance Breakdown