| __timestamp | 3M Company | TransUnion |
|---|---|---|
| Wednesday, January 1, 2014 | 15374000000 | 805600000 |
| Thursday, January 1, 2015 | 14891000000 | 975200000 |
| Friday, January 1, 2016 | 15069000000 | 1125800000 |
| Sunday, January 1, 2017 | 15656000000 | 1288100000 |
| Monday, January 1, 2018 | 16083000000 | 1527100000 |
| Tuesday, January 1, 2019 | 15000000000 | 1782000000 |
| Wednesday, January 1, 2020 | 15579000000 | 1796200000 |
| Friday, January 1, 2021 | 16560000000 | 1968600000 |
| Saturday, January 1, 2022 | 14997000000 | 2487000000 |
| Sunday, January 1, 2023 | 14204000000 | 2313900000 |
| Monday, January 1, 2024 | 10128000000 | 4183800000 |
Data in motion
In the ever-evolving landscape of American industry, 3M Company and TransUnion stand as titans in their respective fields. From 2014 to 2023, 3M's gross profit showcased a robust yet fluctuating trajectory, peaking in 2021 with a 10% increase from 2014. However, by 2023, it saw a decline of approximately 14% from its peak. Meanwhile, TransUnion's growth story is one of remarkable ascent. Starting with a modest base in 2014, it achieved a staggering 188% increase by 2022, reflecting its dynamic expansion in the data and analytics sector. The data for 2024 remains incomplete, leaving room for speculation on future trends. This analysis not only highlights the resilience and adaptability of these companies but also underscores the broader economic shifts influencing their financial performance.
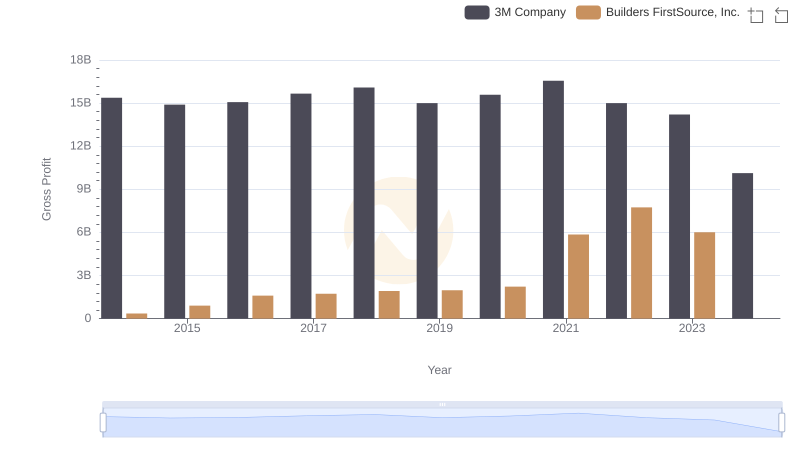
3M Company vs Builders FirstSource, Inc.: A Gross Profit Performance Breakdown
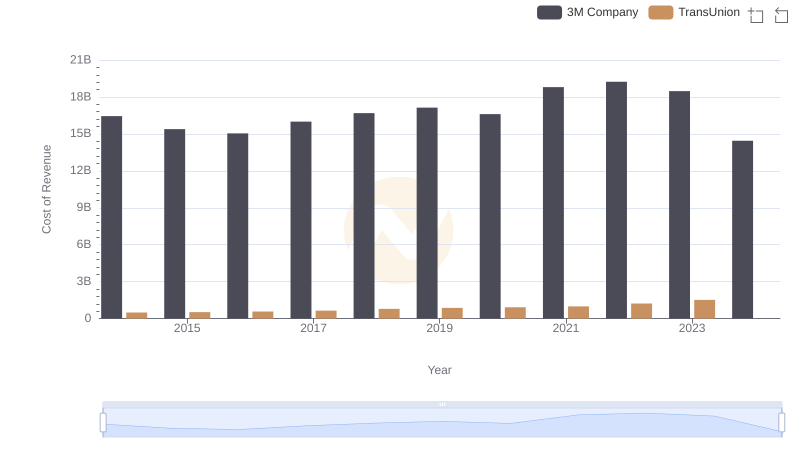
Analyzing Cost of Revenue: 3M Company and TransUnion
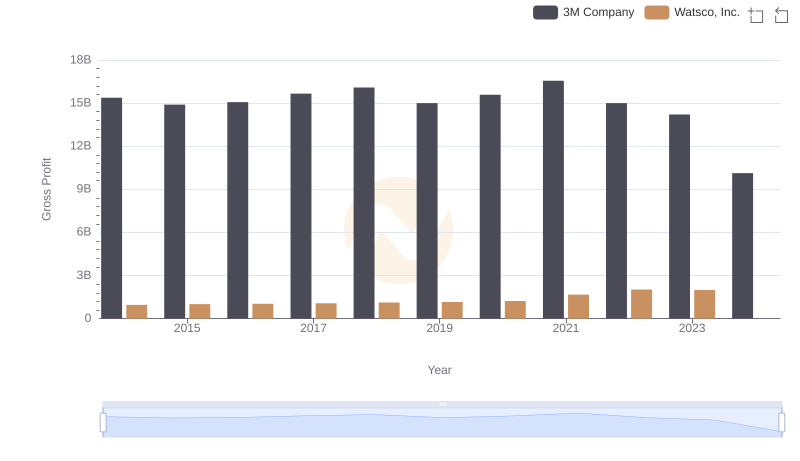
Gross Profit Trends Compared: 3M Company vs Watsco, Inc.
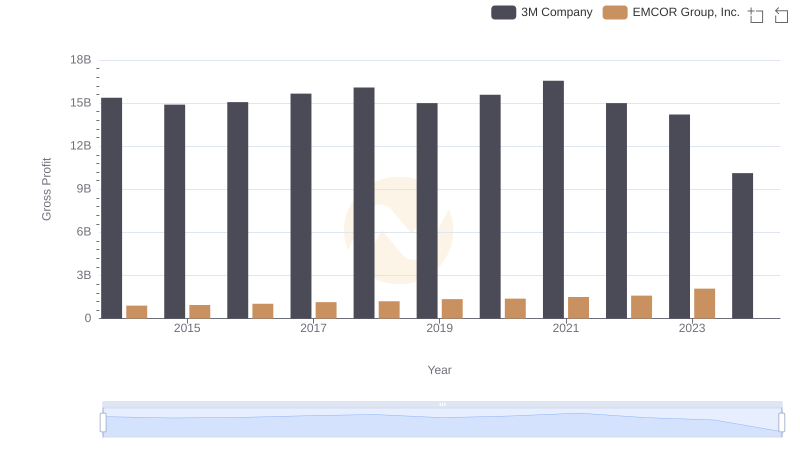
Who Generates Higher Gross Profit? 3M Company or EMCOR Group, Inc.
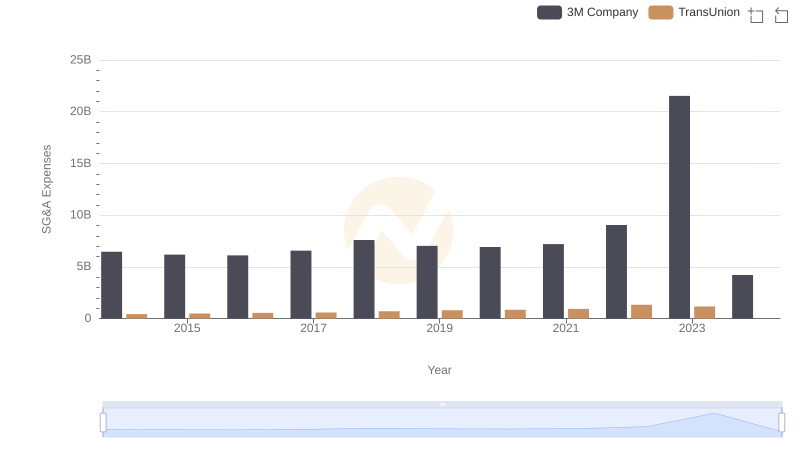
3M Company vs TransUnion: SG&A Expense Trends
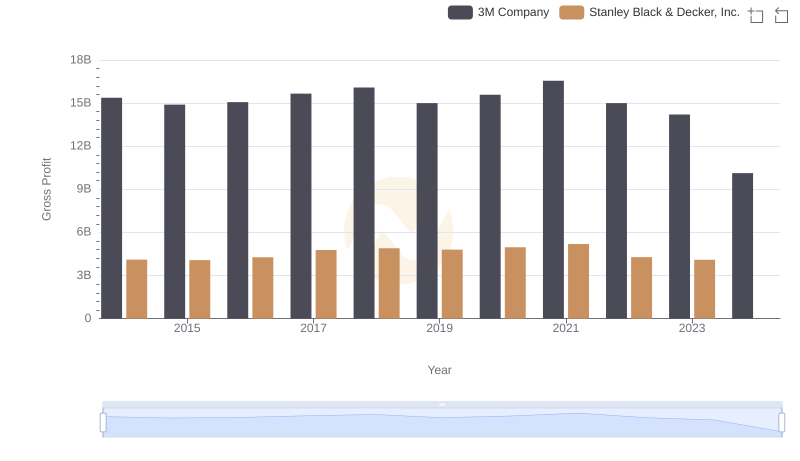
Gross Profit Trends Compared: 3M Company vs Stanley Black & Decker, Inc.