| __timestamp | 3M Company | Watsco, Inc. |
|---|---|---|
| Wednesday, January 1, 2014 | 16447000000 | 2988138000 |
| Thursday, January 1, 2015 | 15383000000 | 3105882000 |
| Friday, January 1, 2016 | 15040000000 | 3186118000 |
| Sunday, January 1, 2017 | 16001000000 | 3276296000 |
| Monday, January 1, 2018 | 16682000000 | 3426401000 |
| Tuesday, January 1, 2019 | 17136000000 | 3613406000 |
| Wednesday, January 1, 2020 | 16605000000 | 3832107000 |
| Friday, January 1, 2021 | 18795000000 | 4612647000 |
| Saturday, January 1, 2022 | 19232000000 | 5244055000 |
| Sunday, January 1, 2023 | 18477000000 | 5291627000 |
| Monday, January 1, 2024 | 14447000000 | 5573604000 |
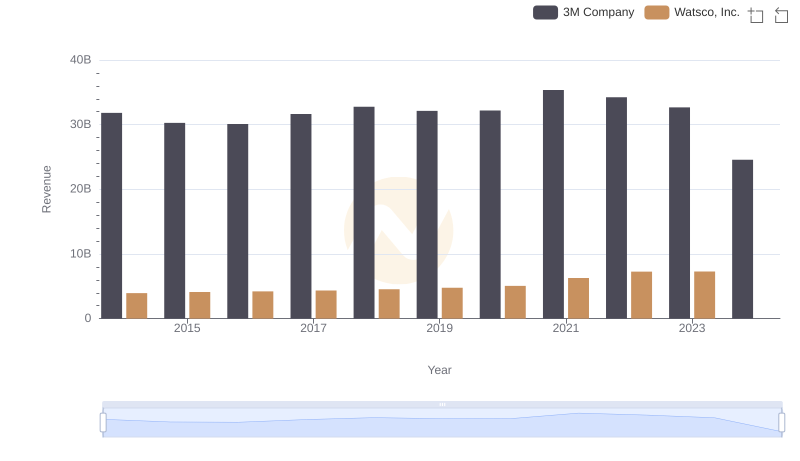
Data in motion
In the ever-evolving landscape of industrial and distribution sectors, 3M Company and Watsco, Inc. have showcased intriguing trends in their cost of revenue over the past decade. From 2014 to 2023, 3M's cost of revenue fluctuated, peaking in 2022 with a 17% increase from 2014, before dropping by 25% in 2024. Meanwhile, Watsco, Inc. demonstrated a consistent upward trajectory, with a remarkable 77% rise from 2014 to 2023. This divergence highlights the contrasting strategies and market conditions faced by these giants. While 3M's recent decline suggests potential operational shifts or market challenges, Watsco's steady growth underscores its robust market positioning. As we look to the future, these trends offer valuable insights into the strategic maneuvers of these industry leaders.
3M Company and Watsco, Inc.: A Comprehensive Revenue Analysis
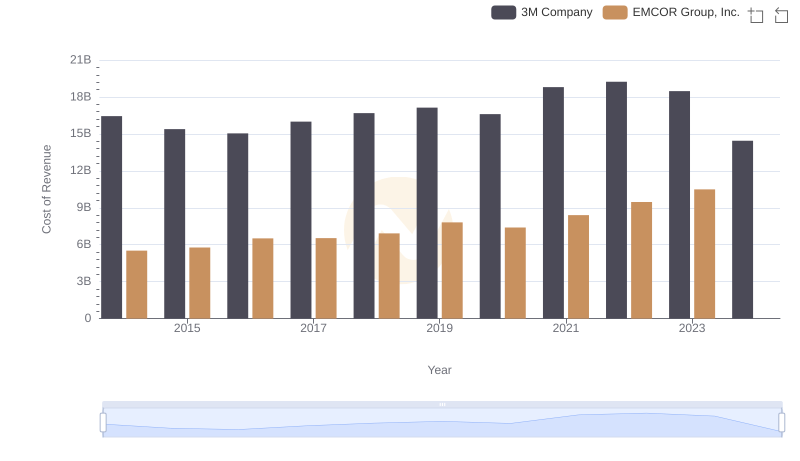
3M Company vs EMCOR Group, Inc.: Efficiency in Cost of Revenue Explored
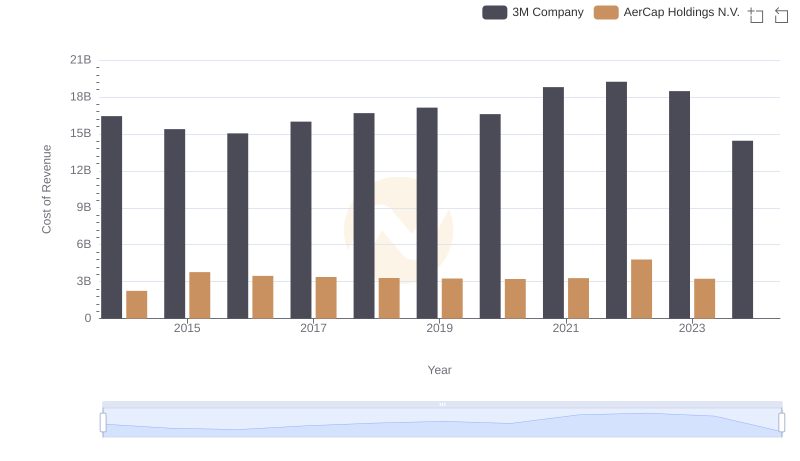
3M Company vs AerCap Holdings N.V.: Efficiency in Cost of Revenue Explored
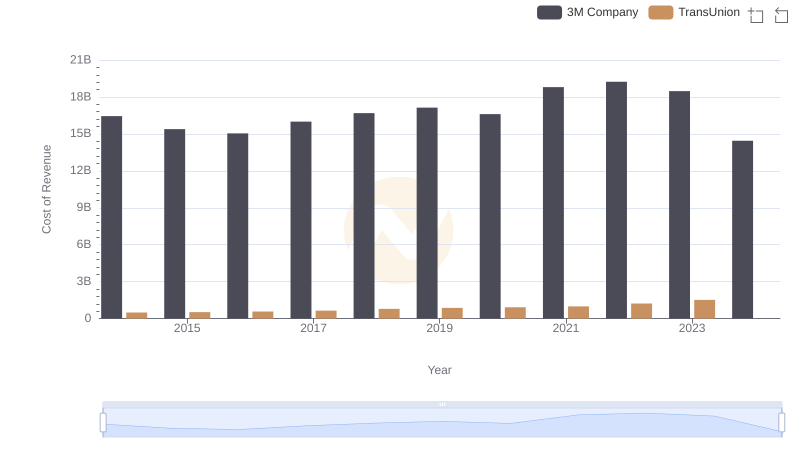
Analyzing Cost of Revenue: 3M Company and TransUnion
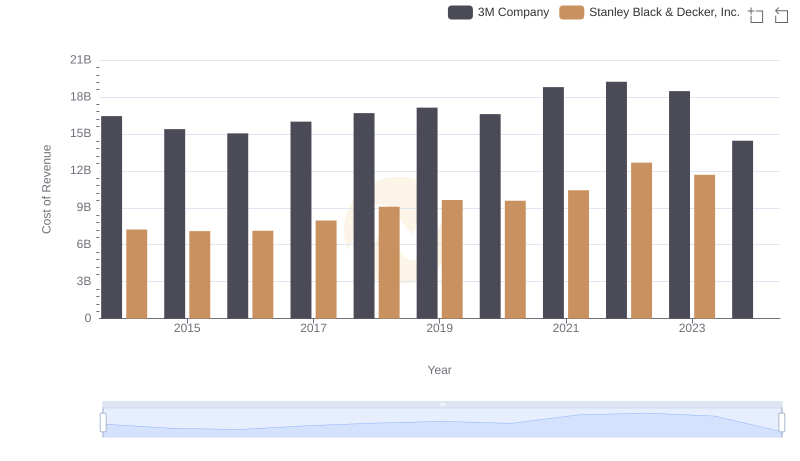
3M Company vs Stanley Black & Decker, Inc.: Efficiency in Cost of Revenue Explored
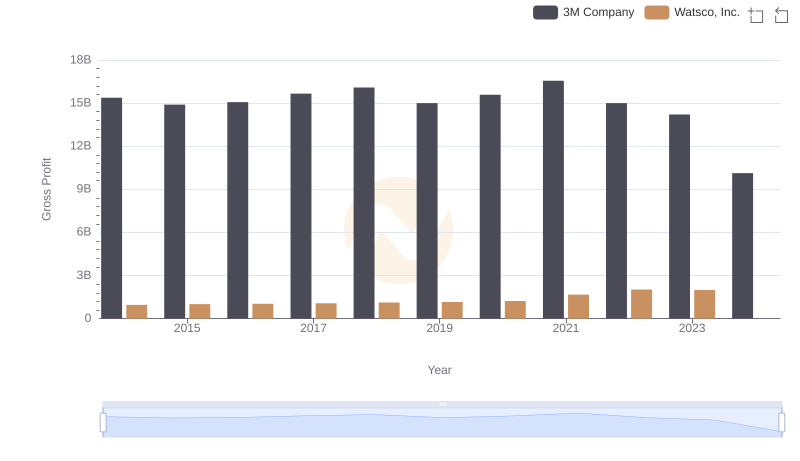
Gross Profit Trends Compared: 3M Company vs Watsco, Inc.
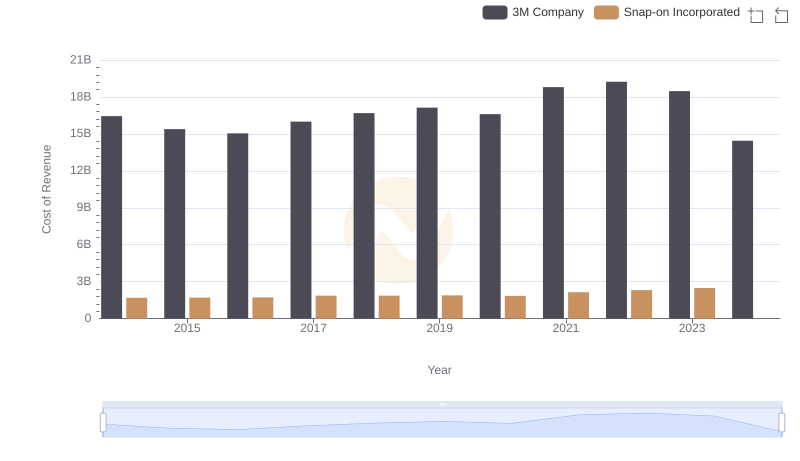
Cost of Revenue Comparison: 3M Company vs Snap-on Incorporated