| __timestamp | 3M Company | Stanley Black & Decker, Inc. |
|---|---|---|
| Wednesday, January 1, 2014 | 15374000000 | 4102700000 |
| Thursday, January 1, 2015 | 14891000000 | 4072000000 |
| Friday, January 1, 2016 | 15069000000 | 4267200000 |
| Sunday, January 1, 2017 | 15656000000 | 4778000000 |
| Monday, January 1, 2018 | 16083000000 | 4901900000 |
| Tuesday, January 1, 2019 | 15000000000 | 4805500000 |
| Wednesday, January 1, 2020 | 15579000000 | 4967900000 |
| Friday, January 1, 2021 | 16560000000 | 5194200000 |
| Saturday, January 1, 2022 | 14997000000 | 4284100000 |
| Sunday, January 1, 2023 | 14204000000 | 4098000000 |
| Monday, January 1, 2024 | 10128000000 | 4514400000 |
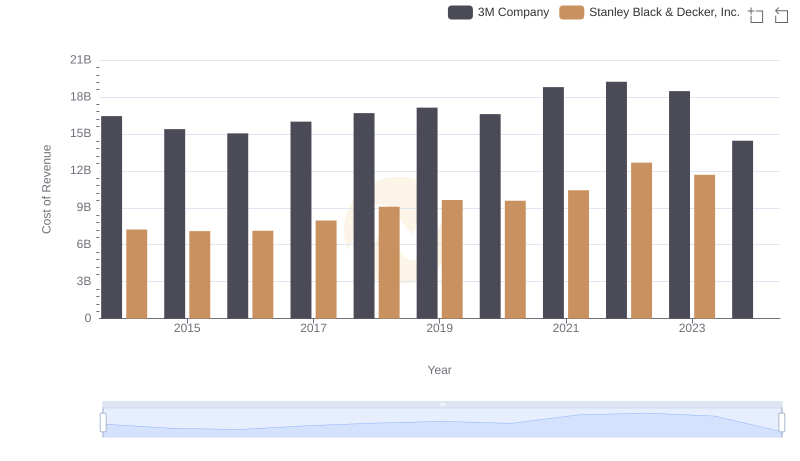
Unlocking the unknown
In the ever-evolving landscape of industrial manufacturing, 3M Company and Stanley Black & Decker, Inc. have long been titans. From 2014 to 2023, 3M's gross profit showcased a dynamic journey, peaking in 2021 with a 10% increase from 2014, before experiencing a decline by 2023. Meanwhile, Stanley Black & Decker's gross profit saw a steady rise, reaching its zenith in 2021 with a 27% increase from 2014, before slightly dipping in 2023. Notably, 2024 data for Stanley Black & Decker remains elusive, leaving room for speculation. This comparison highlights the resilience and adaptability of these industry leaders amidst economic shifts. As we look to the future, the question remains: how will these giants navigate the challenges ahead?