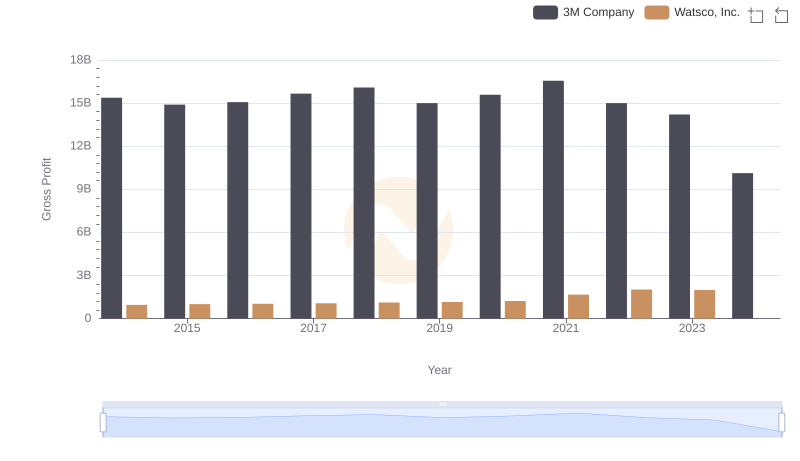
| __timestamp | 3M Company | Watsco, Inc. |
|---|---|---|
| Wednesday, January 1, 2014 | 31821000000 | 3944540000 |
| Thursday, January 1, 2015 | 30274000000 | 4113239000 |
| Friday, January 1, 2016 | 30109000000 | 4220702000 |
| Sunday, January 1, 2017 | 31657000000 | 4341955000 |
| Monday, January 1, 2018 | 32765000000 | 4546653000 |
| Tuesday, January 1, 2019 | 32136000000 | 4770362000 |
| Wednesday, January 1, 2020 | 32184000000 | 5054928000 |
| Friday, January 1, 2021 | 35355000000 | 6280192000 |
| Saturday, January 1, 2022 | 34229000000 | 7274344000 |
| Sunday, January 1, 2023 | 32681000000 | 7283767000 |
| Monday, January 1, 2024 | 24575000000 | 7618317000 |
Unleashing insights
In the ever-evolving landscape of industrial and consumer goods, 3M Company and Watsco, Inc. have showcased intriguing revenue trajectories over the past decade. From 2014 to 2023, 3M's revenue exhibited a steady pattern, peaking in 2021 with a 12% increase from 2016. However, a notable dip in 2024 suggests potential market challenges or strategic shifts. Meanwhile, Watsco, Inc. demonstrated a robust growth trajectory, with revenues nearly doubling from 2014 to 2023, reflecting a strong market position in the HVAC distribution sector. The absence of 2024 data for Watsco hints at either reporting delays or strategic changes. This comparative analysis not only highlights the resilience and adaptability of these companies but also underscores the broader economic trends influencing their sectors. As we look to the future, these insights provide a valuable lens through which to anticipate market movements.