| __timestamp | Builders FirstSource, Inc. | Waste Management, Inc. |
|---|---|---|
| Wednesday, January 1, 2014 | 1604096000 | 13996000000 |
| Thursday, January 1, 2015 | 3564425000 | 12961000000 |
| Friday, January 1, 2016 | 6367284000 | 13609000000 |
| Sunday, January 1, 2017 | 7034209000 | 14485000000 |
| Monday, January 1, 2018 | 7724771000 | 14914000000 |
| Tuesday, January 1, 2019 | 7280431000 | 15455000000 |
| Wednesday, January 1, 2020 | 8558874000 | 15218000000 |
| Friday, January 1, 2021 | 19893856000 | 17931000000 |
| Saturday, January 1, 2022 | 22726418000 | 19698000000 |
| Sunday, January 1, 2023 | 17097330000 | 20426000000 |
| Monday, January 1, 2024 | 22063000000 |
Unleashing the power of data
In the ever-evolving landscape of American business, Waste Management, Inc. and Builders FirstSource, Inc. stand as titans in their respective fields. Over the past decade, these companies have showcased remarkable revenue trajectories, reflecting broader economic trends. From 2014 to 2023, Builders FirstSource, Inc. experienced a staggering growth of over 960%, with revenue peaking in 2022. This surge underscores the booming construction industry, driven by urbanization and infrastructure development.
Conversely, Waste Management, Inc. demonstrated steady growth, with a 46% increase in revenue over the same period. This consistent rise highlights the growing emphasis on sustainable waste solutions and environmental responsibility. By 2023, Waste Management's revenue reached its zenith, reflecting its pivotal role in the green economy. These trends not only illustrate the resilience of these industries but also offer a glimpse into the future of American enterprise.

Breaking Down Revenue Trends: Waste Management, Inc. vs Lennox International Inc.
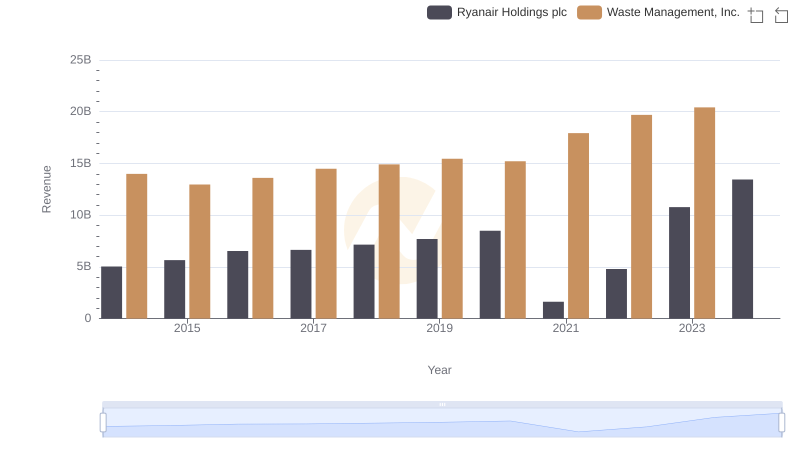
Waste Management, Inc. or Ryanair Holdings plc: Who Leads in Yearly Revenue?
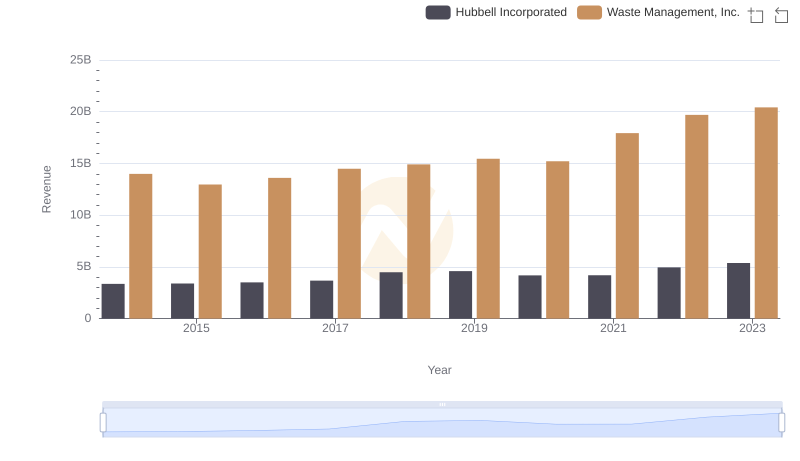
Waste Management, Inc. vs Hubbell Incorporated: Annual Revenue Growth Compared
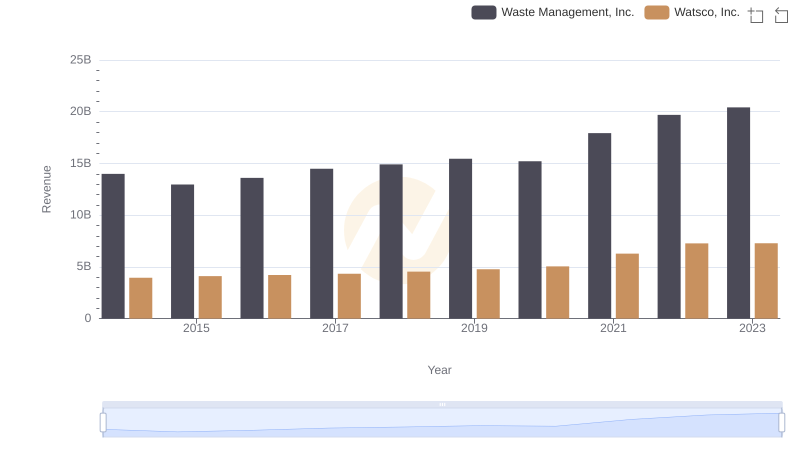
Revenue Showdown: Waste Management, Inc. vs Watsco, Inc.
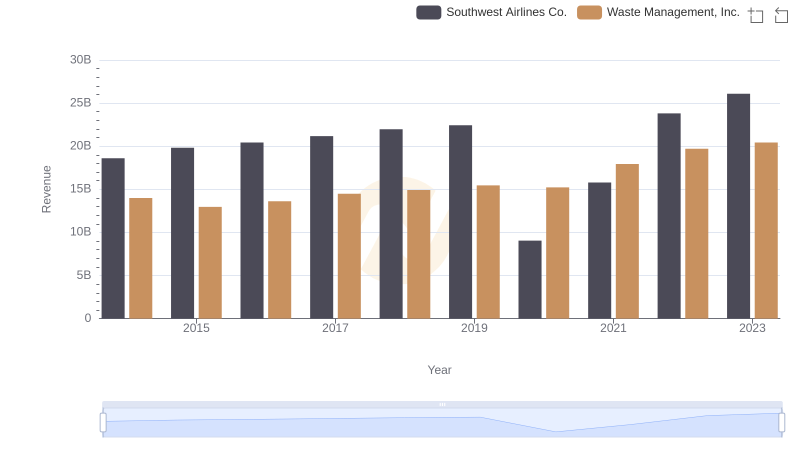
Revenue Insights: Waste Management, Inc. and Southwest Airlines Co. Performance Compared
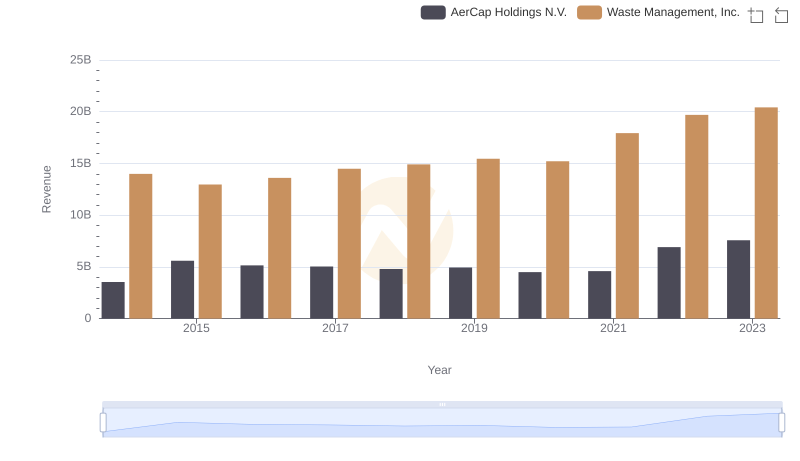
Annual Revenue Comparison: Waste Management, Inc. vs AerCap Holdings N.V.
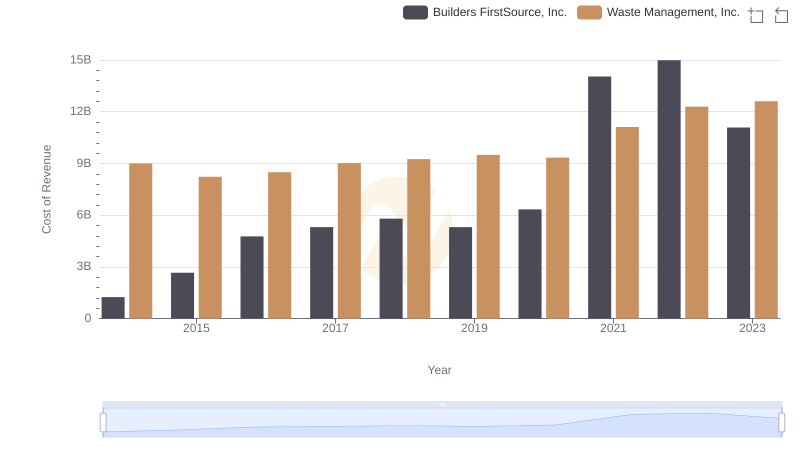
Cost Insights: Breaking Down Waste Management, Inc. and Builders FirstSource, Inc.'s Expenses
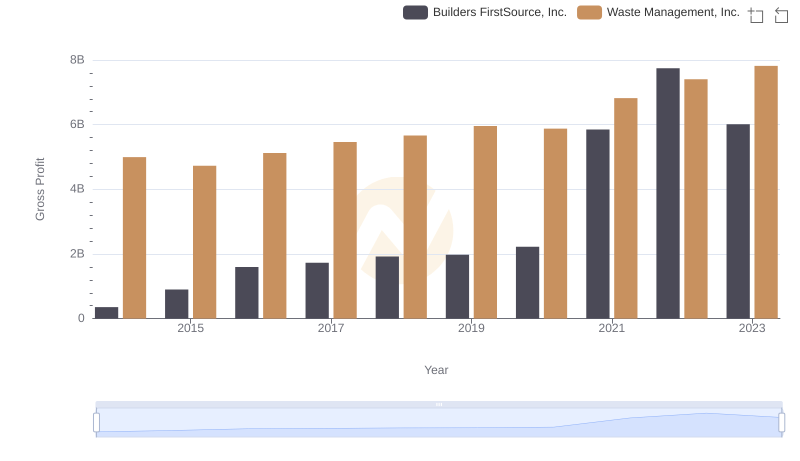
Gross Profit Comparison: Waste Management, Inc. and Builders FirstSource, Inc. Trends
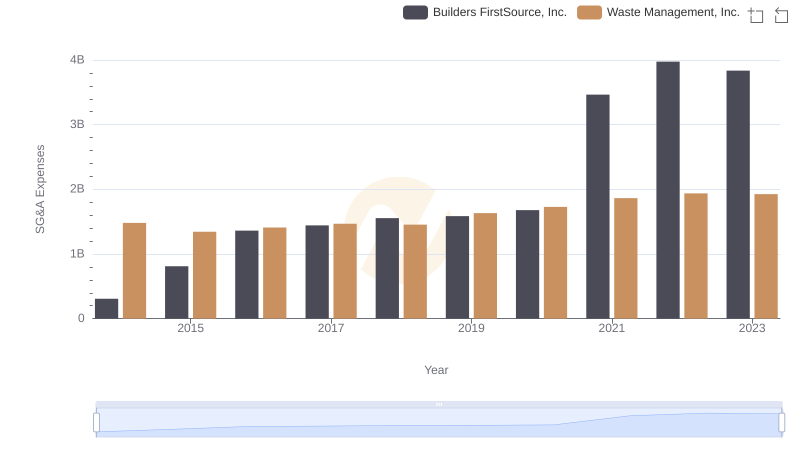
Who Optimizes SG&A Costs Better? Waste Management, Inc. or Builders FirstSource, Inc.
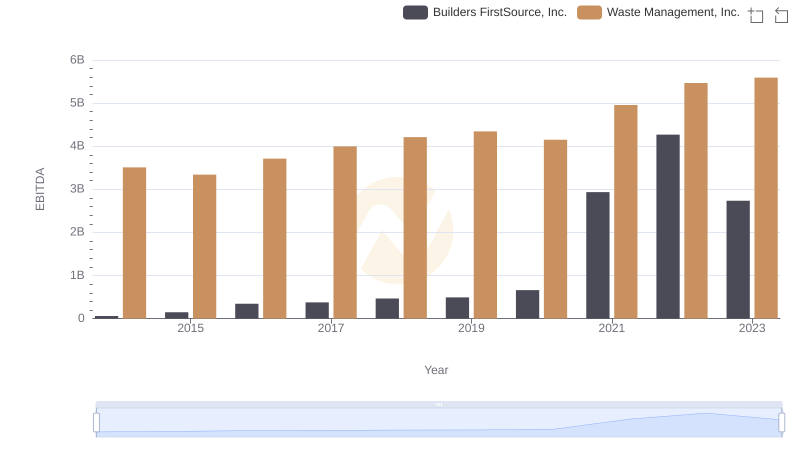
EBITDA Performance Review: Waste Management, Inc. vs Builders FirstSource, Inc.