| __timestamp | Builders FirstSource, Inc. | Waste Management, Inc. |
|---|---|---|
| Wednesday, January 1, 2014 | 60008000 | 3509000000 |
| Thursday, January 1, 2015 | 148897000 | 3342000000 |
| Friday, January 1, 2016 | 346129000 | 3713000000 |
| Sunday, January 1, 2017 | 378096000 | 3996000000 |
| Monday, January 1, 2018 | 466874000 | 4212000000 |
| Tuesday, January 1, 2019 | 492344000 | 4344000000 |
| Wednesday, January 1, 2020 | 660420000 | 4149000000 |
| Friday, January 1, 2021 | 2934776000 | 4956000000 |
| Saturday, January 1, 2022 | 4267346000 | 5466000000 |
| Sunday, January 1, 2023 | 2734594000 | 5592000000 |
| Monday, January 1, 2024 | 5128000000 |
Data in motion
In the ever-evolving landscape of American industry, Waste Management, Inc. and Builders FirstSource, Inc. have emerged as key players, each carving out a significant niche. Over the past decade, from 2014 to 2023, these companies have demonstrated remarkable EBITDA growth, reflecting their strategic prowess and market adaptability.
Waste Management, Inc., a stalwart in the waste management sector, has consistently shown robust performance, with EBITDA increasing by approximately 60% over the period. This growth underscores the company's ability to capitalize on sustainable waste solutions and efficient operations.
Conversely, Builders FirstSource, Inc., a leader in the construction materials industry, has experienced a staggering 4,500% surge in EBITDA, highlighting its aggressive expansion and strategic acquisitions. This meteoric rise is a testament to the booming construction market and the company's agile response to industry demands.
As these giants continue to innovate and expand, their financial trajectories offer valuable insights into the broader economic trends shaping their respective sectors.
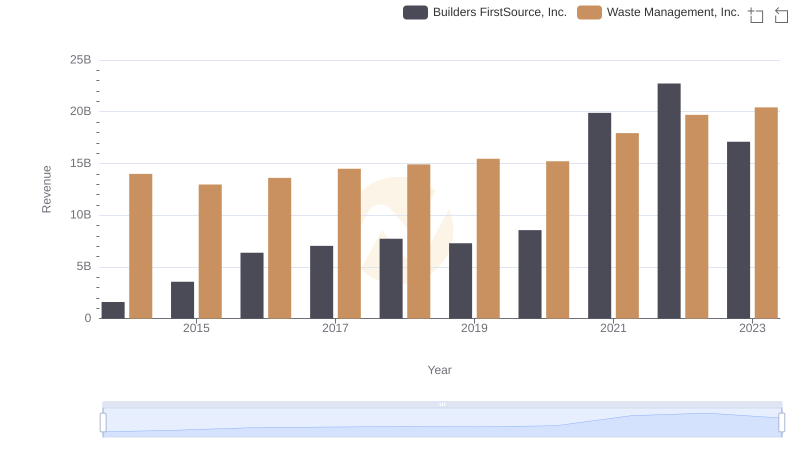
Breaking Down Revenue Trends: Waste Management, Inc. vs Builders FirstSource, Inc.
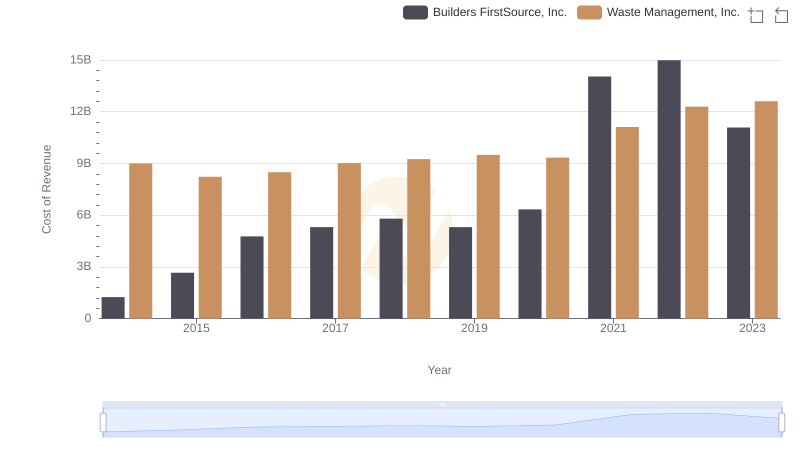
Cost Insights: Breaking Down Waste Management, Inc. and Builders FirstSource, Inc.'s Expenses
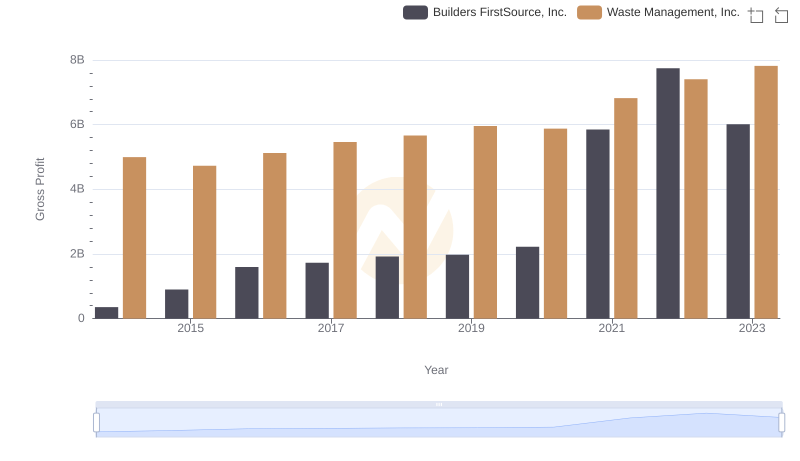
Gross Profit Comparison: Waste Management, Inc. and Builders FirstSource, Inc. Trends
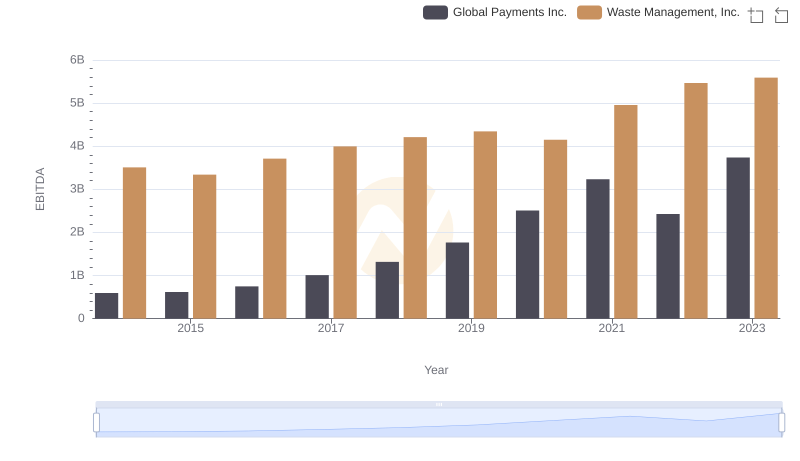
A Professional Review of EBITDA: Waste Management, Inc. Compared to Global Payments Inc.
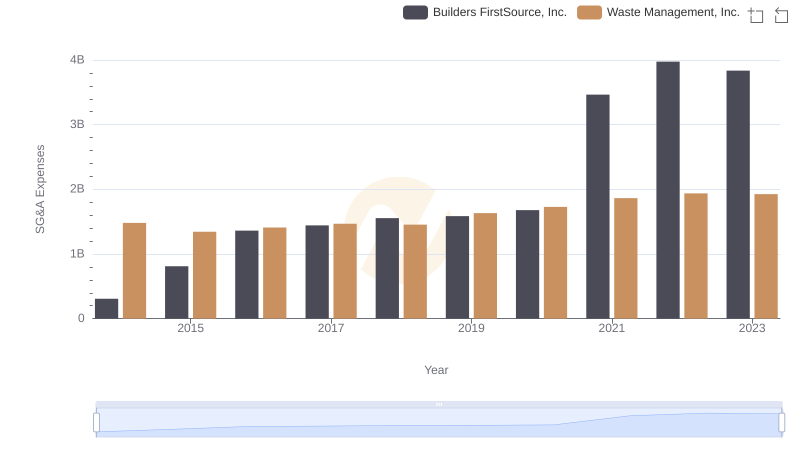
Who Optimizes SG&A Costs Better? Waste Management, Inc. or Builders FirstSource, Inc.
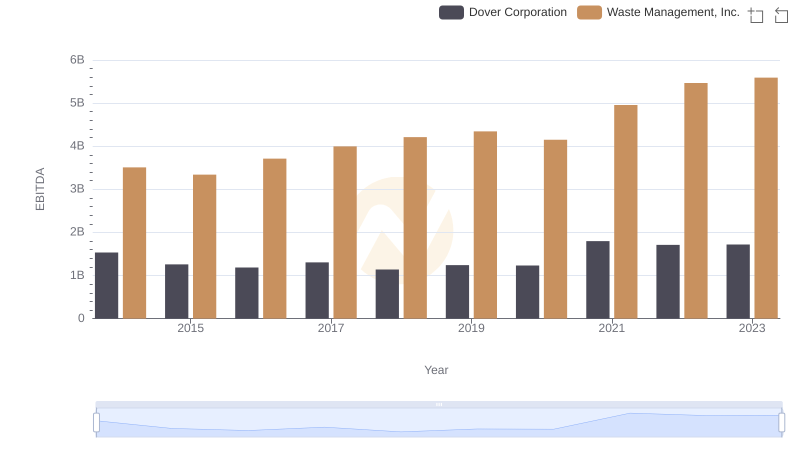
EBITDA Performance Review: Waste Management, Inc. vs Dover Corporation
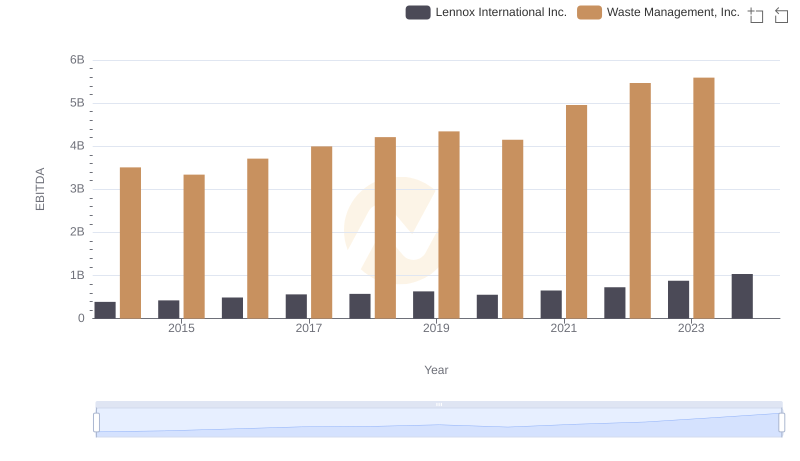
A Side-by-Side Analysis of EBITDA: Waste Management, Inc. and Lennox International Inc.
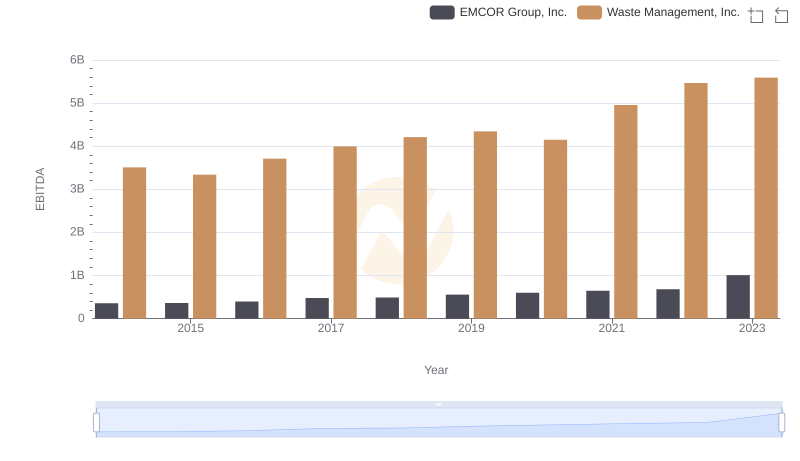
Comprehensive EBITDA Comparison: Waste Management, Inc. vs EMCOR Group, Inc.
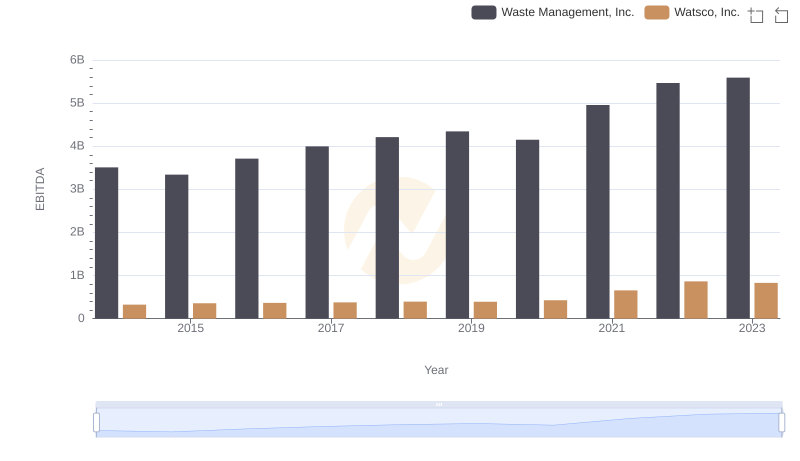
Professional EBITDA Benchmarking: Waste Management, Inc. vs Watsco, Inc.
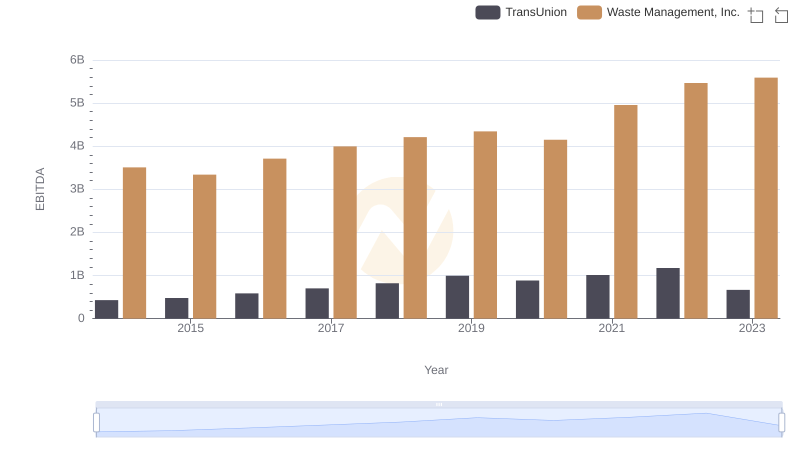
A Professional Review of EBITDA: Waste Management, Inc. Compared to TransUnion