| __timestamp | Ferguson plc | Trane Technologies plc |
|---|---|---|
| Wednesday, January 1, 2014 | 6203188666 | 3908600000 |
| Thursday, January 1, 2015 | 5816457079 | 3999100000 |
| Friday, January 1, 2016 | 5389727937 | 4179600000 |
| Sunday, January 1, 2017 | 5793596551 | 4386000000 |
| Monday, January 1, 2018 | 6044000000 | 4820600000 |
| Tuesday, January 1, 2019 | 6458000000 | 5147400000 |
| Wednesday, January 1, 2020 | 6421000000 | 3803400000 |
| Friday, January 1, 2021 | 6980000000 | 4469600000 |
| Saturday, January 1, 2022 | 8756000000 | 4964800000 |
| Sunday, January 1, 2023 | 9025000000 | 5857200000 |
| Monday, January 1, 2024 | 9053000000 | 7080500000 |
Igniting the spark of knowledge
In the competitive landscape of industrial giants, Trane Technologies plc and Ferguson plc have showcased intriguing gross profit trajectories over the past decade. Ferguson plc, a leader in the building materials sector, has seen its gross profit soar by approximately 46% from 2014 to 2023, peaking at an impressive $9 billion in 2023. This growth underscores Ferguson's robust market strategies and adaptability in a dynamic economic environment.
Conversely, Trane Technologies plc, a key player in climate solutions, experienced a more modest growth of around 50% over the same period, reaching nearly $5.9 billion in 2023. Despite a dip in 2020, Trane's recovery highlights its resilience and commitment to innovation.
While Ferguson's consistent upward trend is noteworthy, Trane's journey reflects the challenges and opportunities within the climate solutions industry. Missing data for 2024 suggests an evolving narrative worth watching.
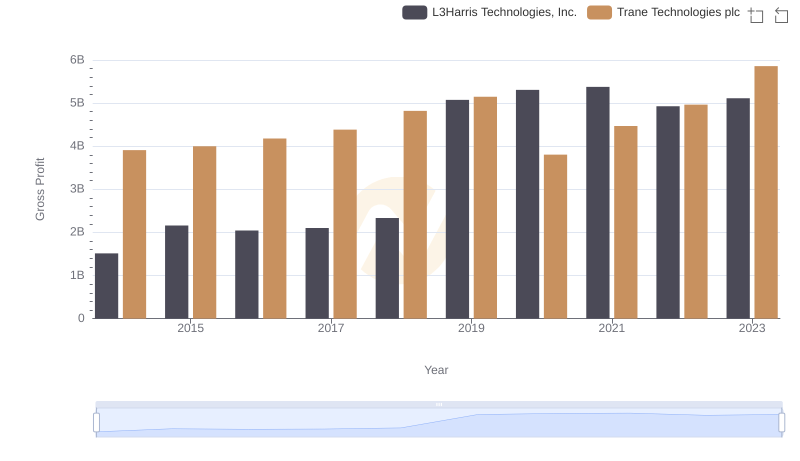
Gross Profit Comparison: Trane Technologies plc and L3Harris Technologies, Inc. Trends
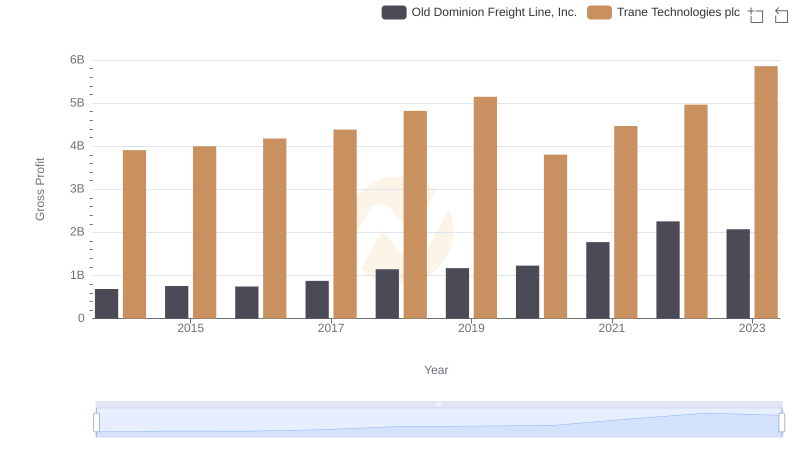
Key Insights on Gross Profit: Trane Technologies plc vs Old Dominion Freight Line, Inc.
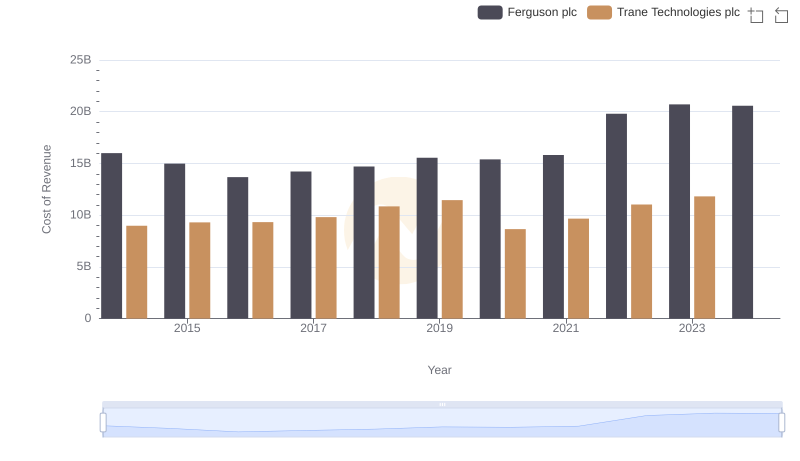
Analyzing Cost of Revenue: Trane Technologies plc and Ferguson plc
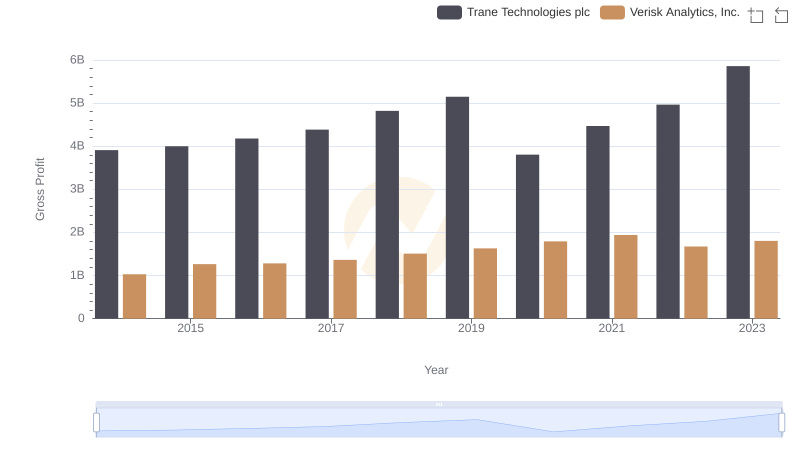
Gross Profit Trends Compared: Trane Technologies plc vs Verisk Analytics, Inc.
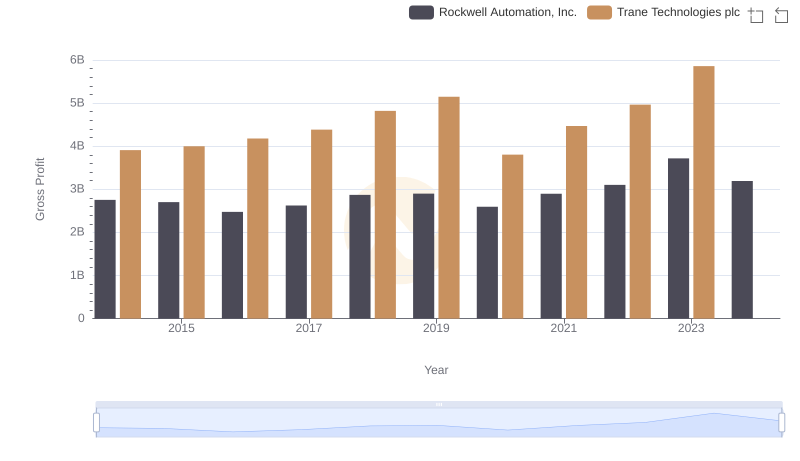
Who Generates Higher Gross Profit? Trane Technologies plc or Rockwell Automation, Inc.
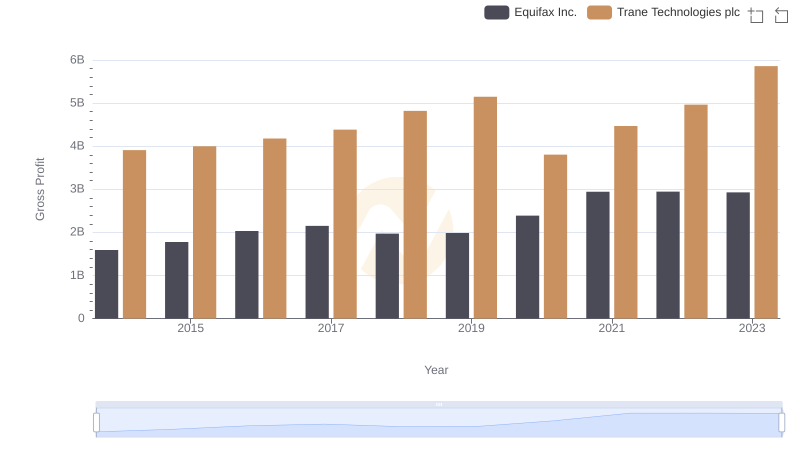
Trane Technologies plc and Equifax Inc.: A Detailed Gross Profit Analysis
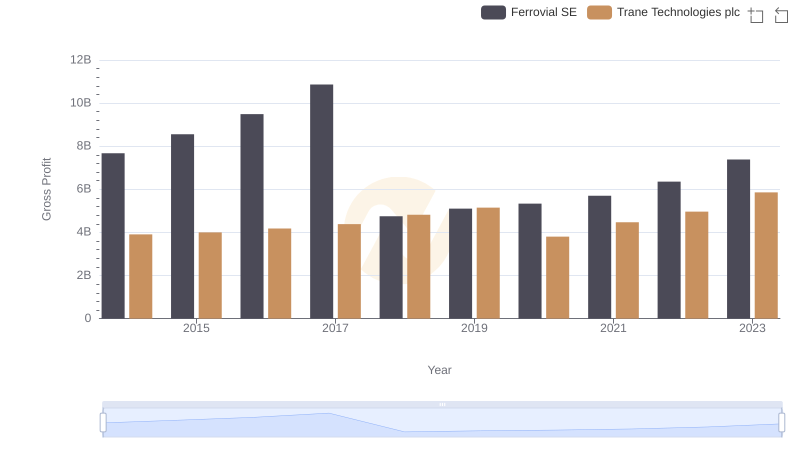
Trane Technologies plc vs Ferrovial SE: A Gross Profit Performance Breakdown
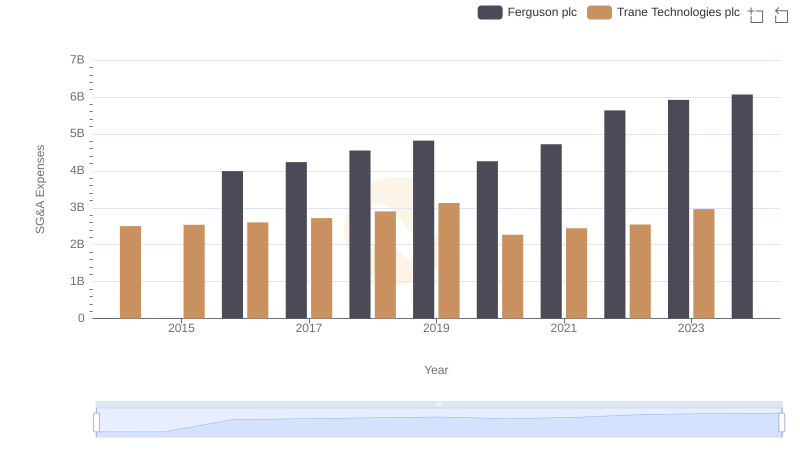
Trane Technologies plc vs Ferguson plc: SG&A Expense Trends