| __timestamp | Old Dominion Freight Line, Inc. | Trane Technologies plc |
|---|---|---|
| Wednesday, January 1, 2014 | 687488000 | 3908600000 |
| Thursday, January 1, 2015 | 757499000 | 3999100000 |
| Friday, January 1, 2016 | 744627000 | 4179600000 |
| Sunday, January 1, 2017 | 875380000 | 4386000000 |
| Monday, January 1, 2018 | 1144243000 | 4820600000 |
| Tuesday, January 1, 2019 | 1170216000 | 5147400000 |
| Wednesday, January 1, 2020 | 1228598000 | 3803400000 |
| Friday, January 1, 2021 | 1775060000 | 4469600000 |
| Saturday, January 1, 2022 | 2256126000 | 4964800000 |
| Sunday, January 1, 2023 | 2072199000 | 5857200000 |
| Monday, January 1, 2024 | 7080500000 |
In pursuit of knowledge
In the ever-evolving landscape of industrial giants, Trane Technologies plc and Old Dominion Freight Line, Inc. have carved out significant niches. Over the past decade, Trane Technologies has consistently outperformed Old Dominion in terms of gross profit, boasting an average of 4.55 billion USD annually, nearly four times that of Old Dominion's 1.27 billion USD. This trend highlights Trane's robust market position and strategic prowess.
From 2014 to 2023, Trane Technologies saw a remarkable 50% increase in gross profit, peaking at 5.86 billion USD in 2023. Meanwhile, Old Dominion experienced a substantial 200% growth, reaching 2.07 billion USD in the same year. This growth trajectory underscores Old Dominion's aggressive expansion and operational efficiency.
As we look to the future, these companies' financial trajectories offer valuable insights into their strategic directions and market dynamics.
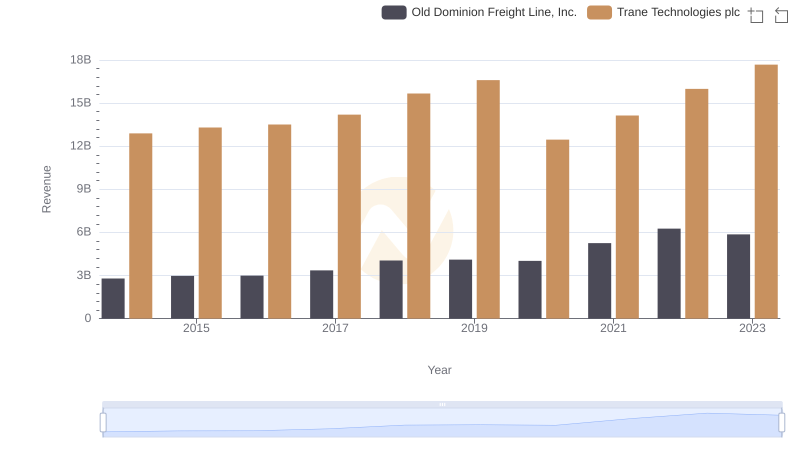
Annual Revenue Comparison: Trane Technologies plc vs Old Dominion Freight Line, Inc.
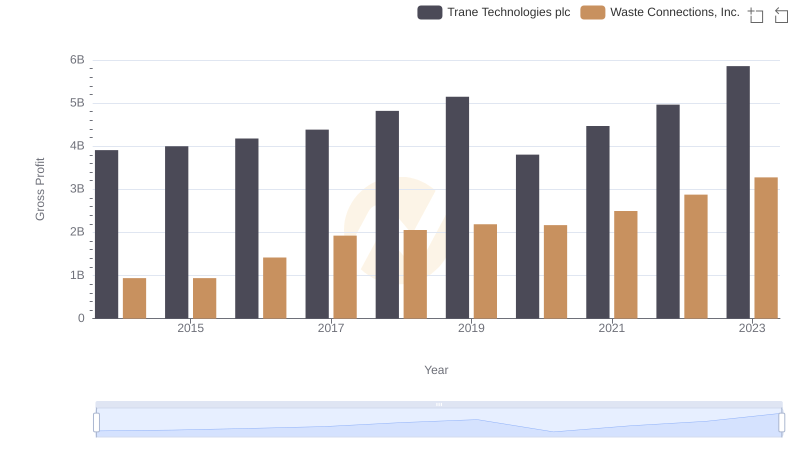
Gross Profit Comparison: Trane Technologies plc and Waste Connections, Inc. Trends
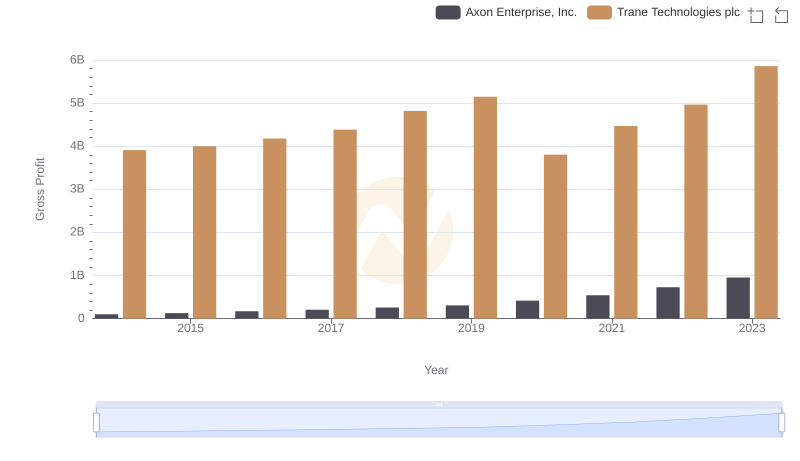
Trane Technologies plc vs Axon Enterprise, Inc.: A Gross Profit Performance Breakdown
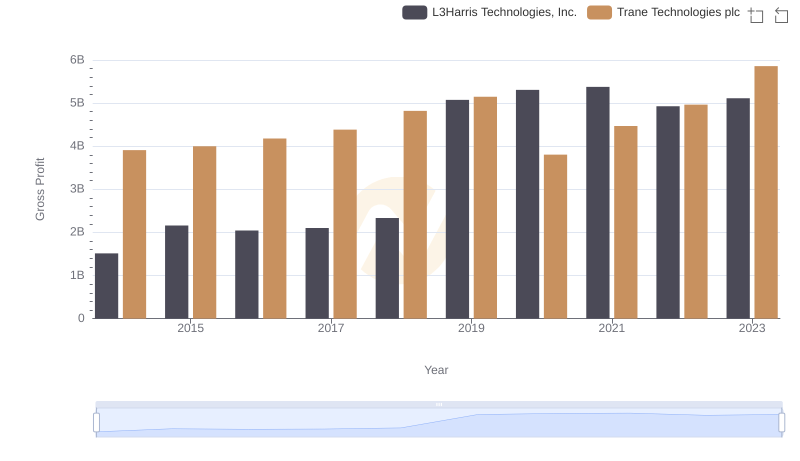
Gross Profit Comparison: Trane Technologies plc and L3Harris Technologies, Inc. Trends
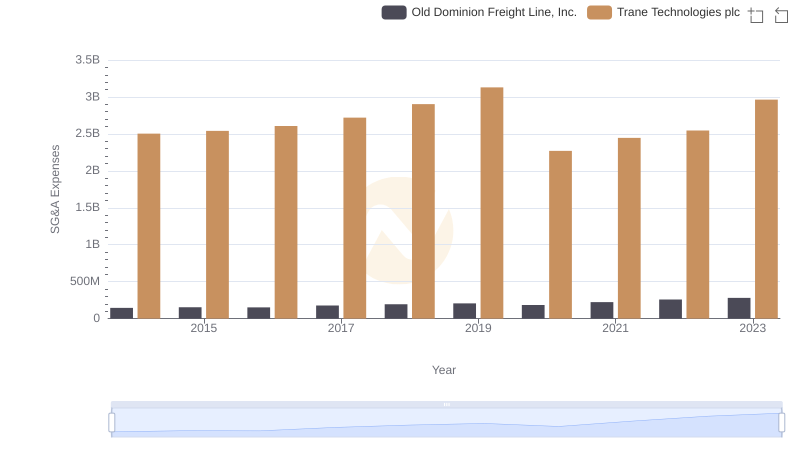
Trane Technologies plc or Old Dominion Freight Line, Inc.: Who Manages SG&A Costs Better?
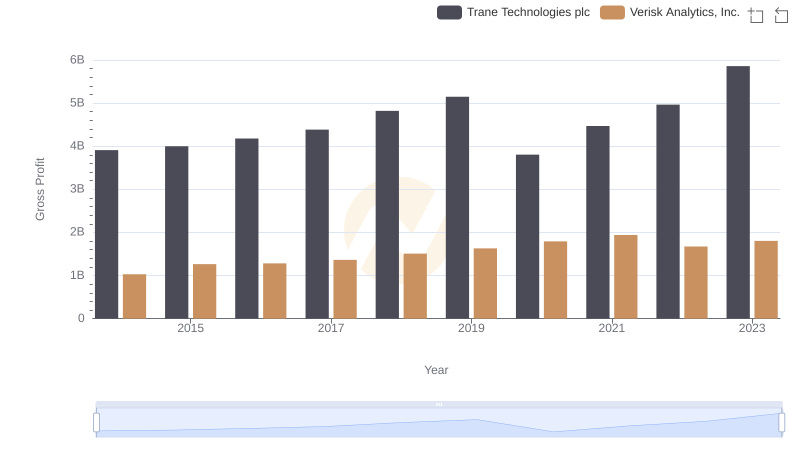
Gross Profit Trends Compared: Trane Technologies plc vs Verisk Analytics, Inc.
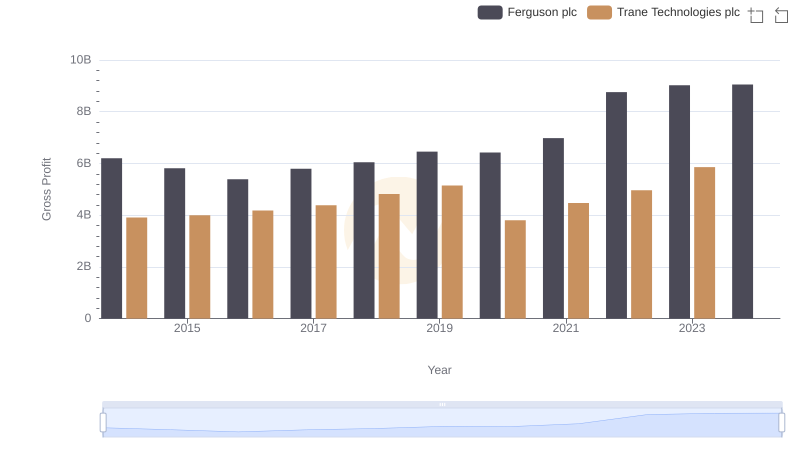
Trane Technologies plc vs Ferguson plc: A Gross Profit Performance Breakdown
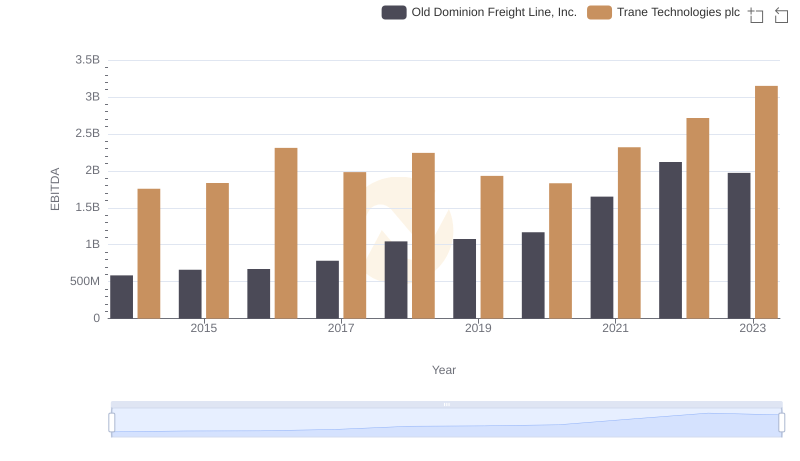
EBITDA Metrics Evaluated: Trane Technologies plc vs Old Dominion Freight Line, Inc.