| __timestamp | Trane Technologies plc | Waste Connections, Inc. |
|---|---|---|
| Wednesday, January 1, 2014 | 3908600000 | 940778000 |
| Thursday, January 1, 2015 | 3999100000 | 939878000 |
| Friday, January 1, 2016 | 4179600000 | 1418151000 |
| Sunday, January 1, 2017 | 4386000000 | 1925713000 |
| Monday, January 1, 2018 | 4820600000 | 2057237000 |
| Tuesday, January 1, 2019 | 5147400000 | 2189922000 |
| Wednesday, January 1, 2020 | 3803400000 | 2169182000 |
| Friday, January 1, 2021 | 4469600000 | 2497287000 |
| Saturday, January 1, 2022 | 4964800000 | 2875847000 |
| Sunday, January 1, 2023 | 5857200000 | 3277438000 |
| Monday, January 1, 2024 | 7080500000 | 3727885000 |
Cracking the code
In the ever-evolving landscape of industrial giants, Trane Technologies plc and Waste Connections, Inc. have showcased remarkable growth trajectories over the past decade. From 2014 to 2023, Trane Technologies has seen its gross profit soar by approximately 50%, reflecting its robust market strategies and innovation in climate solutions. Meanwhile, Waste Connections, a leader in waste management services, has experienced a staggering 250% increase in gross profit, underscoring its expanding footprint in North America.
These trends not only reflect the companies' resilience but also their strategic adaptability in a competitive market.
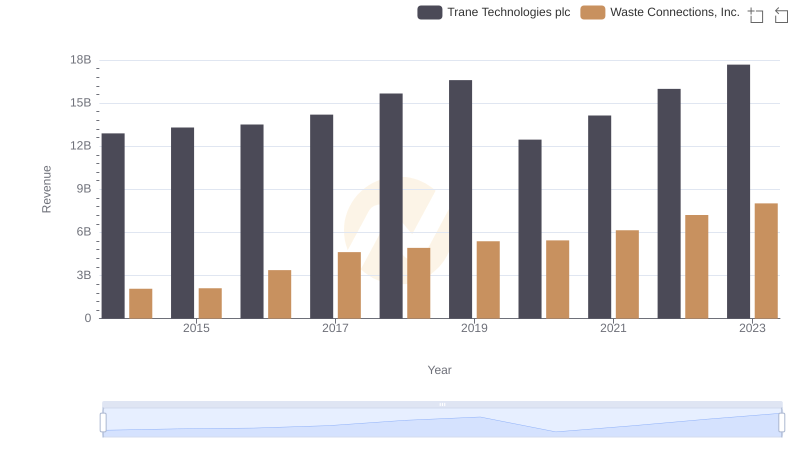
Trane Technologies plc vs Waste Connections, Inc.: Annual Revenue Growth Compared
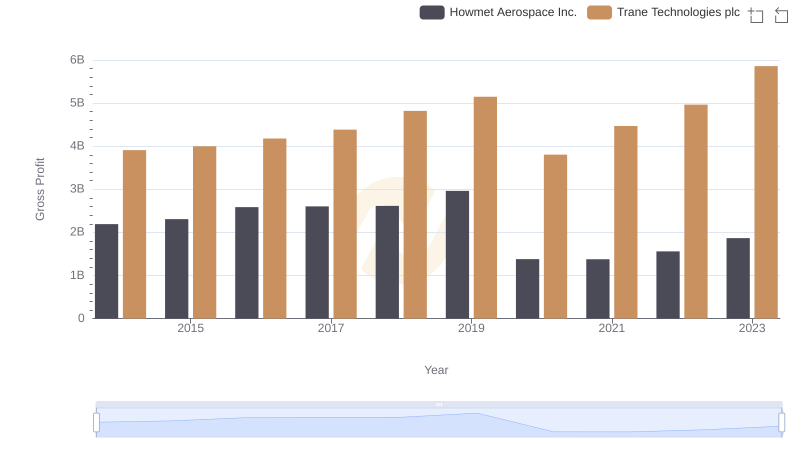
Gross Profit Comparison: Trane Technologies plc and Howmet Aerospace Inc. Trends
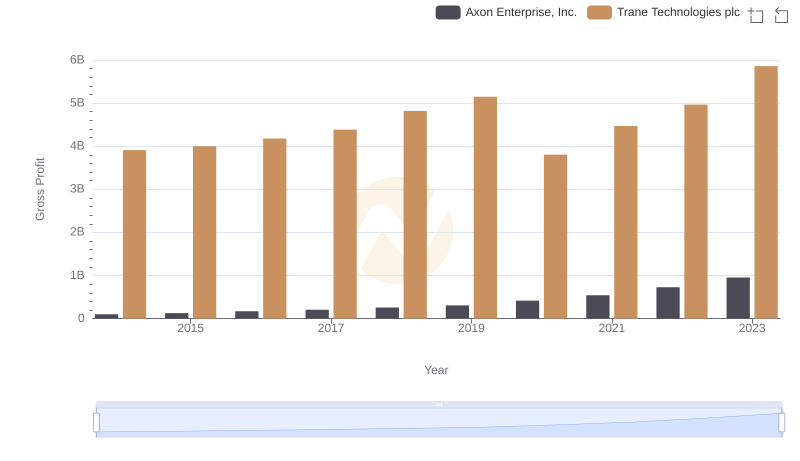
Trane Technologies plc vs Axon Enterprise, Inc.: A Gross Profit Performance Breakdown
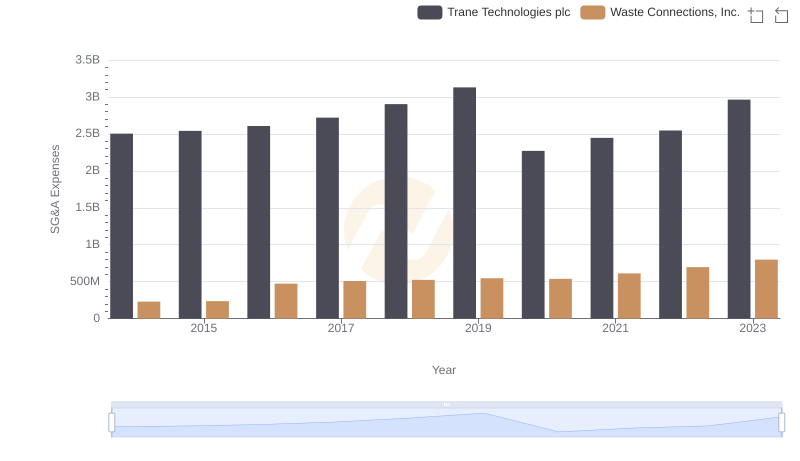
Cost Management Insights: SG&A Expenses for Trane Technologies plc and Waste Connections, Inc.
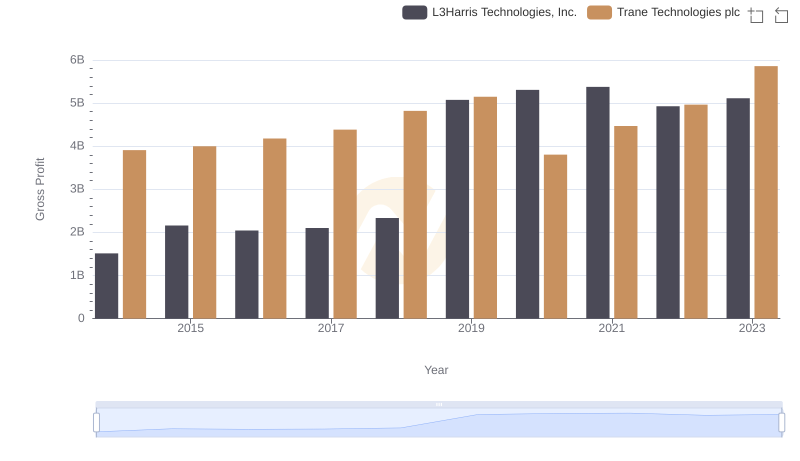
Gross Profit Comparison: Trane Technologies plc and L3Harris Technologies, Inc. Trends
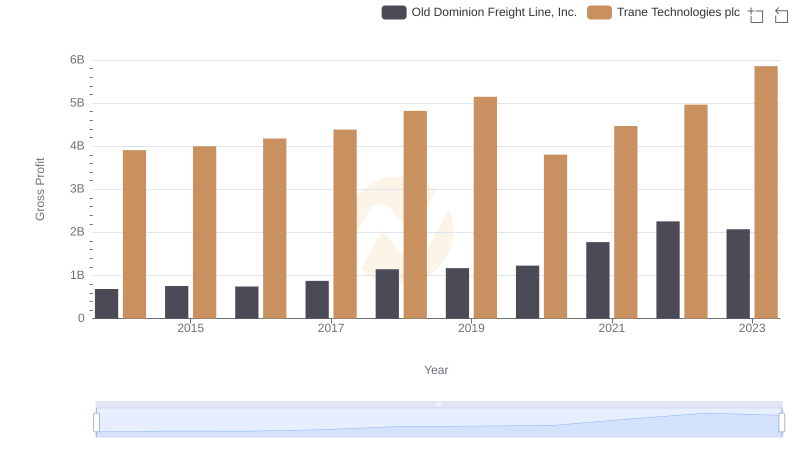
Key Insights on Gross Profit: Trane Technologies plc vs Old Dominion Freight Line, Inc.
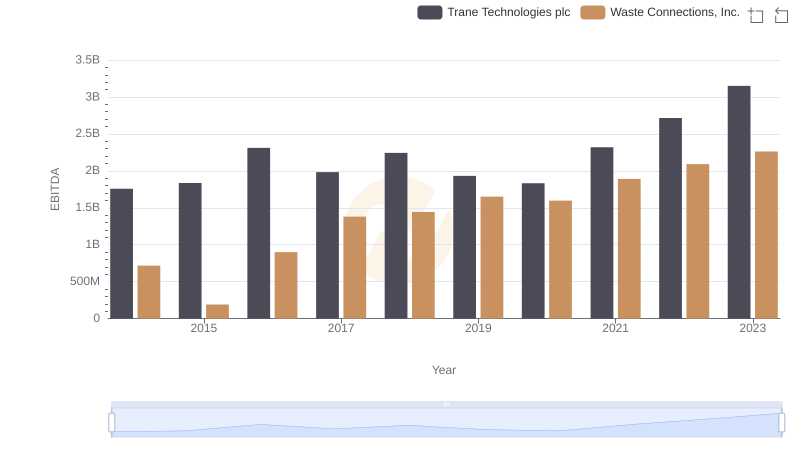
Trane Technologies plc and Waste Connections, Inc.: A Detailed Examination of EBITDA Performance