| __timestamp | Axon Enterprise, Inc. | Trane Technologies plc |
|---|---|---|
| Wednesday, January 1, 2014 | 101548000 | 3908600000 |
| Thursday, January 1, 2015 | 128647000 | 3999100000 |
| Friday, January 1, 2016 | 170536000 | 4179600000 |
| Sunday, January 1, 2017 | 207088000 | 4386000000 |
| Monday, January 1, 2018 | 258583000 | 4820600000 |
| Tuesday, January 1, 2019 | 307286000 | 5147400000 |
| Wednesday, January 1, 2020 | 416331000 | 3803400000 |
| Friday, January 1, 2021 | 540910000 | 4469600000 |
| Saturday, January 1, 2022 | 728638000 | 4964800000 |
| Sunday, January 1, 2023 | 955382000 | 5857200000 |
| Monday, January 1, 2024 | 7080500000 |
In pursuit of knowledge
In the ever-evolving landscape of the stock market, understanding the financial health of companies is crucial. This analysis delves into the gross profit performance of Trane Technologies plc and Axon Enterprise, Inc. over the past decade. From 2014 to 2023, Trane Technologies consistently outperformed Axon, with gross profits peaking at approximately $5.86 billion in 2023, marking a 50% increase from 2014. In contrast, Axon Enterprise, Inc. demonstrated a remarkable growth trajectory, with gross profits surging by over 840% during the same period, reaching nearly $955 million in 2023. This stark contrast highlights Trane's steady dominance in the market, while Axon showcases a dynamic growth story. As investors seek opportunities, these trends offer valuable insights into the strategic positioning and market potential of these two industry players.
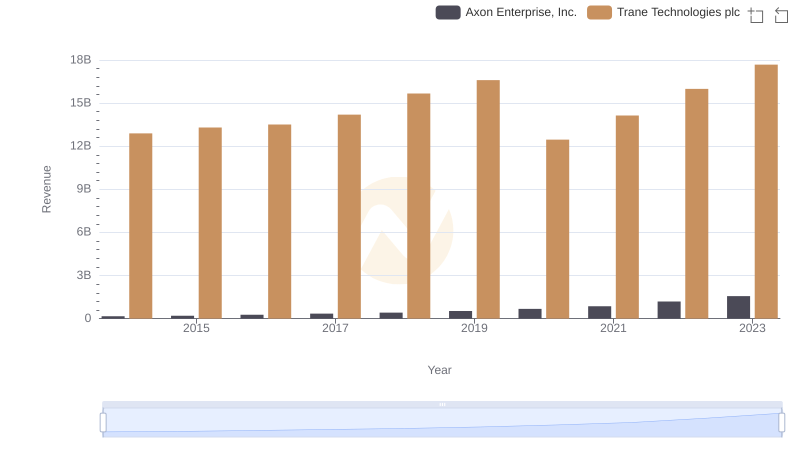
Revenue Showdown: Trane Technologies plc vs Axon Enterprise, Inc.
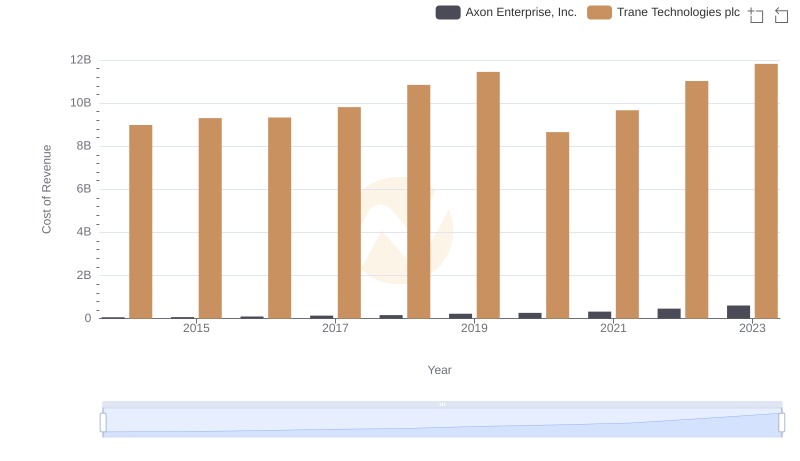
Cost of Revenue: Key Insights for Trane Technologies plc and Axon Enterprise, Inc.
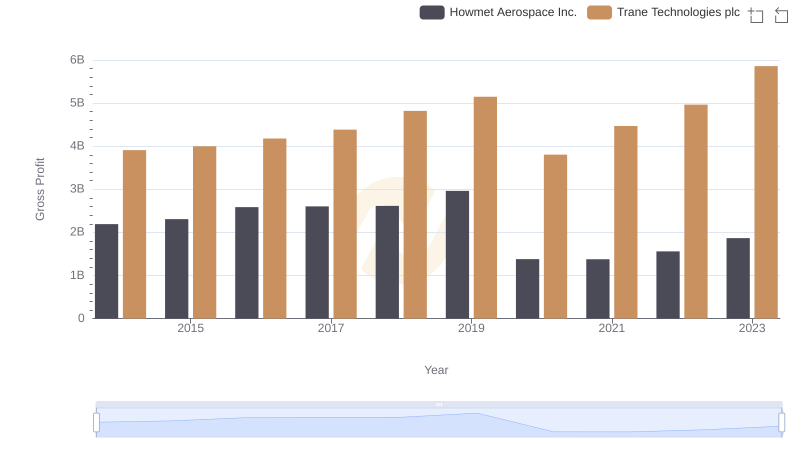
Gross Profit Comparison: Trane Technologies plc and Howmet Aerospace Inc. Trends
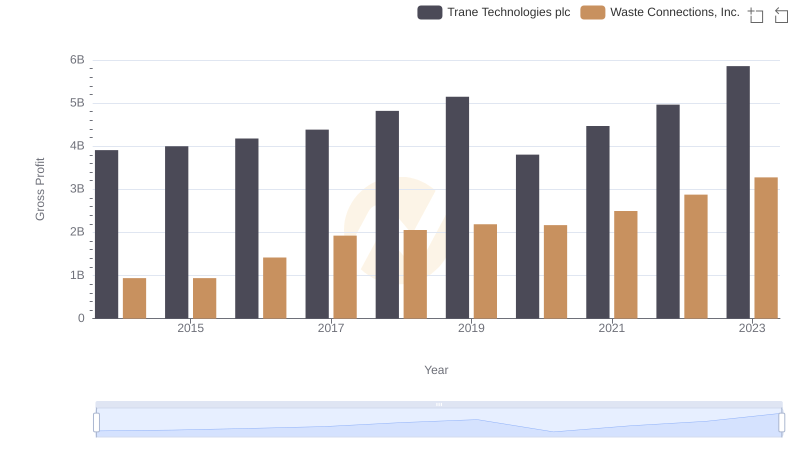
Gross Profit Comparison: Trane Technologies plc and Waste Connections, Inc. Trends
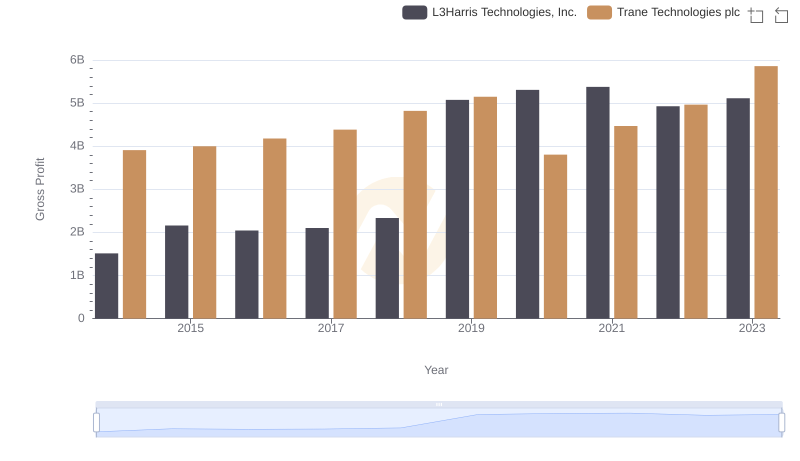
Gross Profit Comparison: Trane Technologies plc and L3Harris Technologies, Inc. Trends
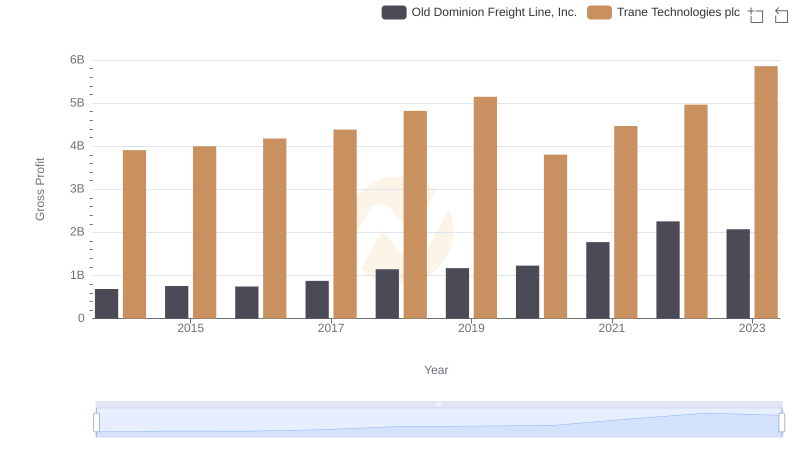
Key Insights on Gross Profit: Trane Technologies plc vs Old Dominion Freight Line, Inc.
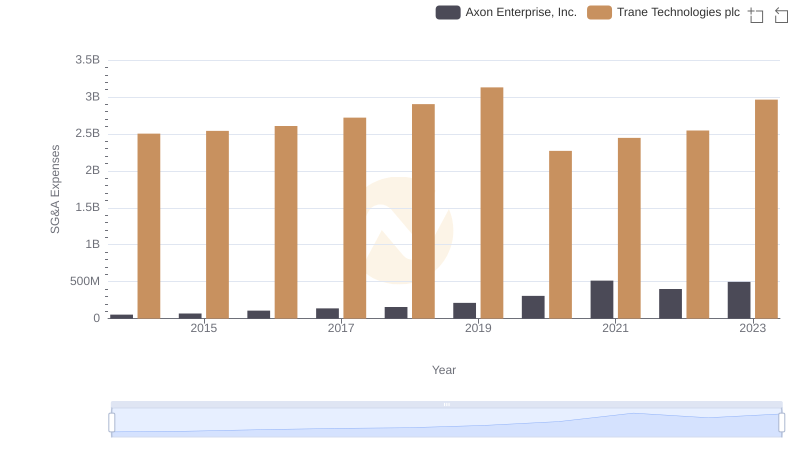
Operational Costs Compared: SG&A Analysis of Trane Technologies plc and Axon Enterprise, Inc.