| __timestamp | Trane Technologies plc | Verisk Analytics, Inc. |
|---|---|---|
| Wednesday, January 1, 2014 | 3908600000 | 1030128000 |
| Thursday, January 1, 2015 | 3999100000 | 1264736000 |
| Friday, January 1, 2016 | 4179600000 | 1280800000 |
| Sunday, January 1, 2017 | 4386000000 | 1361400000 |
| Monday, January 1, 2018 | 4820600000 | 1508900000 |
| Tuesday, January 1, 2019 | 5147400000 | 1630300000 |
| Wednesday, January 1, 2020 | 3803400000 | 1790700000 |
| Friday, January 1, 2021 | 4469600000 | 1940800000 |
| Saturday, January 1, 2022 | 4964800000 | 1672400000 |
| Sunday, January 1, 2023 | 5857200000 | 1804900000 |
| Monday, January 1, 2024 | 7080500000 |
Infusing magic into the data realm
In the ever-evolving landscape of global business, the financial health of companies is a key indicator of their success and resilience. Over the past decade, Trane Technologies plc and Verisk Analytics, Inc. have showcased intriguing trends in their gross profit margins. From 2014 to 2023, Trane Technologies has seen a robust growth of approximately 50%, with a notable peak in 2023. This growth trajectory highlights the company's strategic prowess in navigating market challenges. In contrast, Verisk Analytics, while experiencing a steady increase, has grown by about 75% over the same period, reflecting its stronghold in the analytics sector. The year 2020 marked a dip for Trane Technologies, likely due to global disruptions, yet it rebounded impressively by 2023. These trends underscore the dynamic nature of the business world and the importance of strategic adaptability.
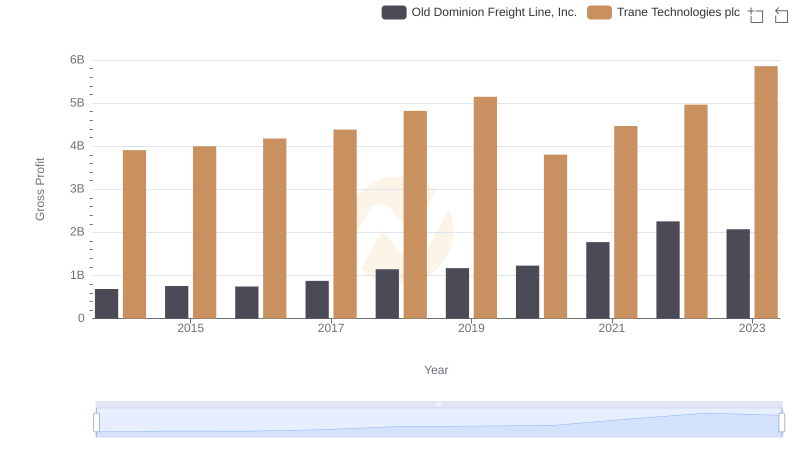
Key Insights on Gross Profit: Trane Technologies plc vs Old Dominion Freight Line, Inc.
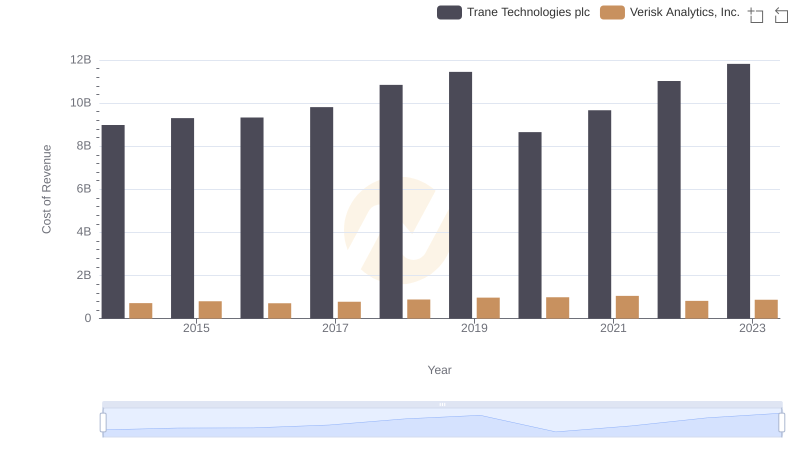
Cost of Revenue Trends: Trane Technologies plc vs Verisk Analytics, Inc.
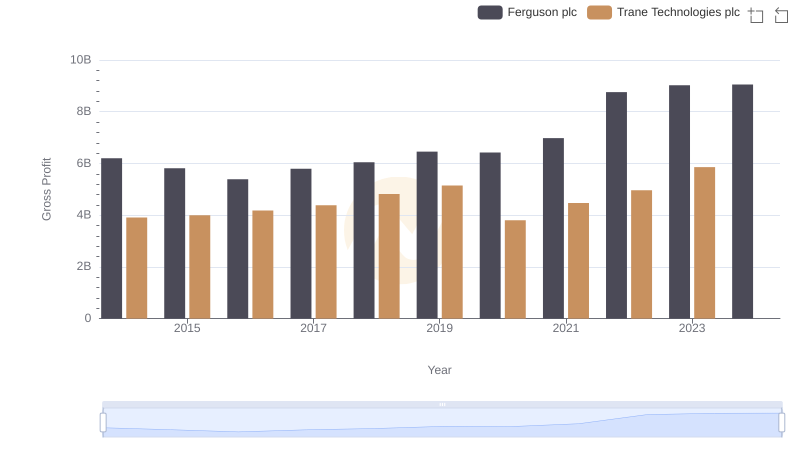
Trane Technologies plc vs Ferguson plc: A Gross Profit Performance Breakdown
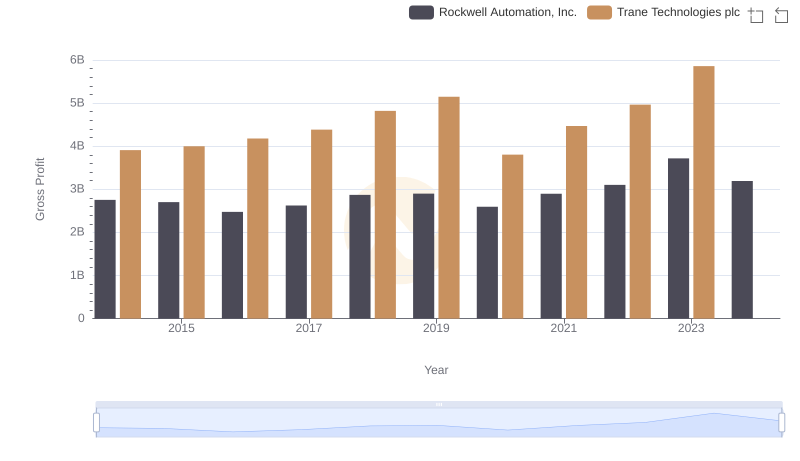
Who Generates Higher Gross Profit? Trane Technologies plc or Rockwell Automation, Inc.
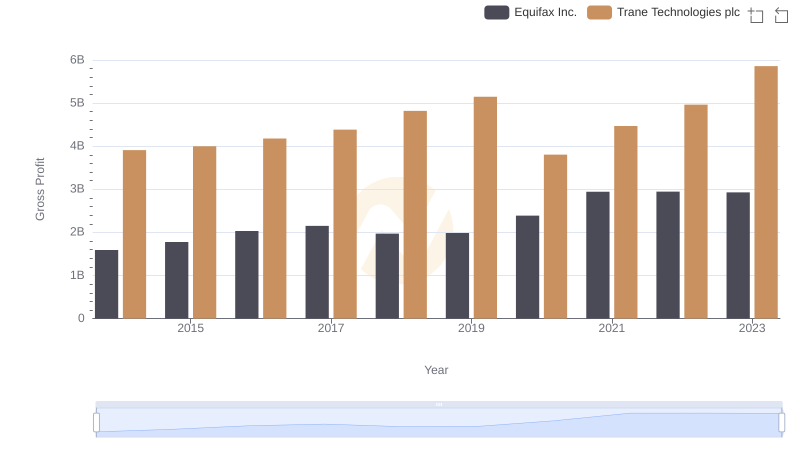
Trane Technologies plc and Equifax Inc.: A Detailed Gross Profit Analysis
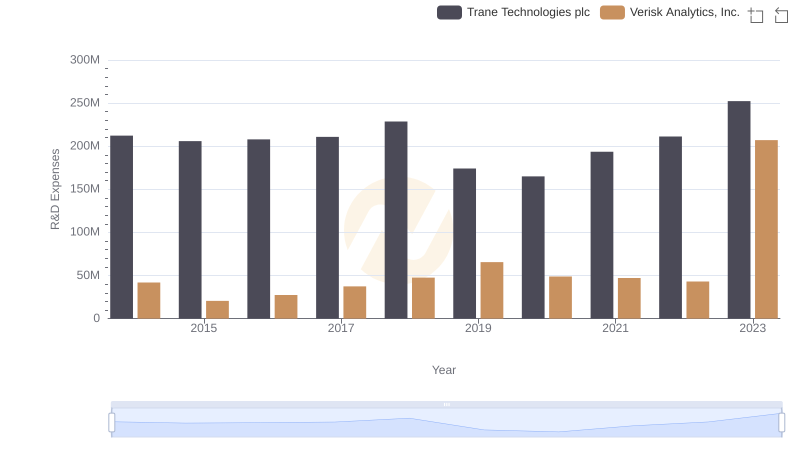
Trane Technologies plc vs Verisk Analytics, Inc.: Strategic Focus on R&D Spending
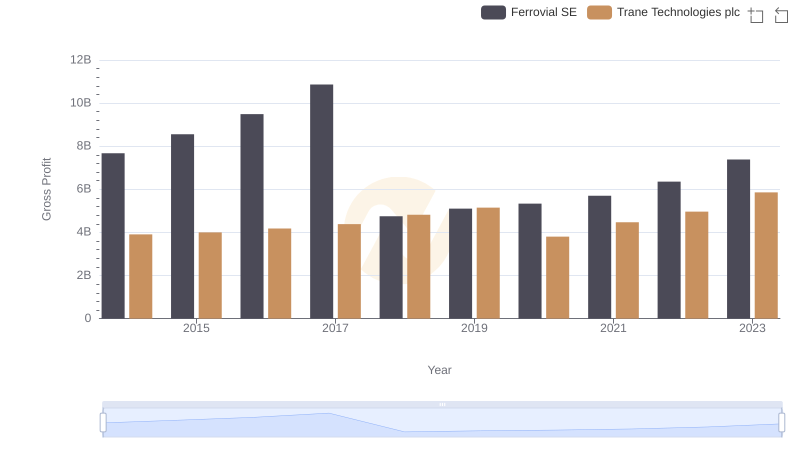
Trane Technologies plc vs Ferrovial SE: A Gross Profit Performance Breakdown
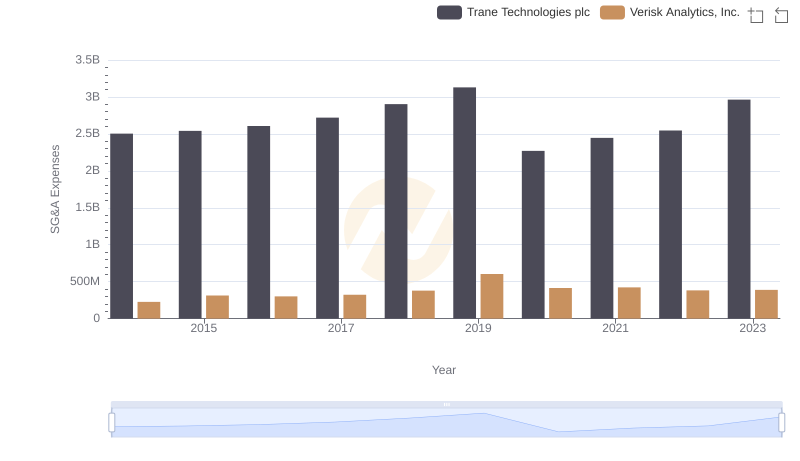
Cost Management Insights: SG&A Expenses for Trane Technologies plc and Verisk Analytics, Inc.