| __timestamp | Global Payments Inc. | Parker-Hannifin Corporation |
|---|---|---|
| Wednesday, January 1, 2014 | 2773718000 | 13215971000 |
| Thursday, January 1, 2015 | 2898150000 | 12711744000 |
| Friday, January 1, 2016 | 3370976000 | 11360753000 |
| Sunday, January 1, 2017 | 3975163000 | 12029312000 |
| Monday, January 1, 2018 | 3366366000 | 14302392000 |
| Tuesday, January 1, 2019 | 4911892000 | 14320324000 |
| Wednesday, January 1, 2020 | 7423558000 | 13695520000 |
| Friday, January 1, 2021 | 8523762000 | 14347640000 |
| Saturday, January 1, 2022 | 8975515000 | 15861608000 |
| Sunday, January 1, 2023 | 9654419000 | 19065194000 |
| Monday, January 1, 2024 | 10105894000 | 19929606000 |
Unveiling the hidden dimensions of data
In the ever-evolving landscape of industrial and financial sectors, Parker-Hannifin Corporation and Global Payments Inc. stand as titans. Over the past decade, Parker-Hannifin has consistently outpaced Global Payments in annual revenue, showcasing its dominance in the industrial sector. From 2014 to 2023, Parker-Hannifin's revenue surged by approximately 44%, reaching nearly $19 billion in 2023. In contrast, Global Payments, a leader in the financial services industry, experienced a remarkable growth of 248% over the same period, closing in on $10 billion in 2023.
Despite the impressive growth trajectory of Global Payments, Parker-Hannifin's revenue remains nearly double, highlighting its robust market position. However, the absence of data for Global Payments in 2024 leaves room for speculation on its future performance. As these two giants continue to innovate, their financial journeys offer valuable insights into the dynamics of their respective industries.
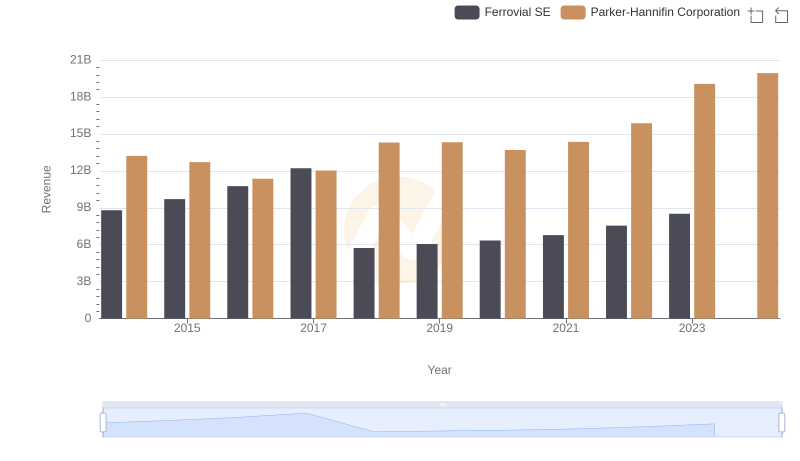
Parker-Hannifin Corporation vs Ferrovial SE: Examining Key Revenue Metrics
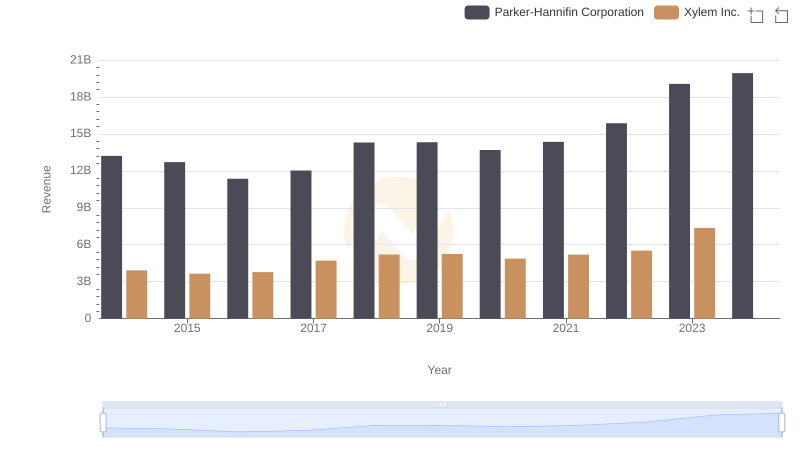
Annual Revenue Comparison: Parker-Hannifin Corporation vs Xylem Inc.
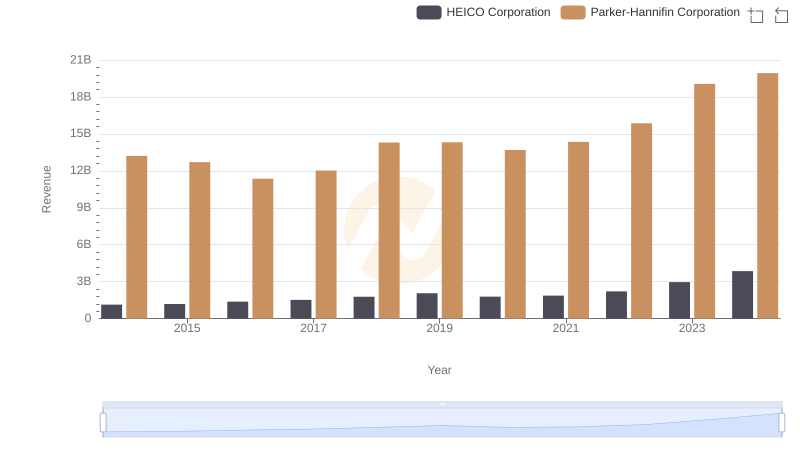
Comparing Revenue Performance: Parker-Hannifin Corporation or HEICO Corporation?

Who Generates More Revenue? Parker-Hannifin Corporation or Dover Corporation
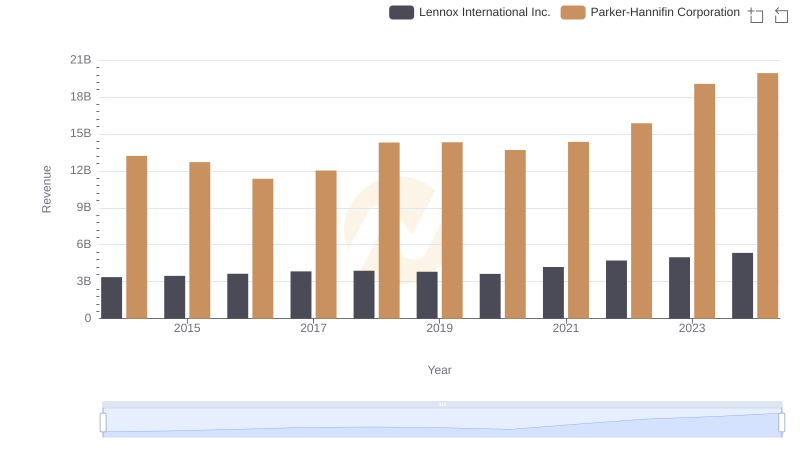
Annual Revenue Comparison: Parker-Hannifin Corporation vs Lennox International Inc.
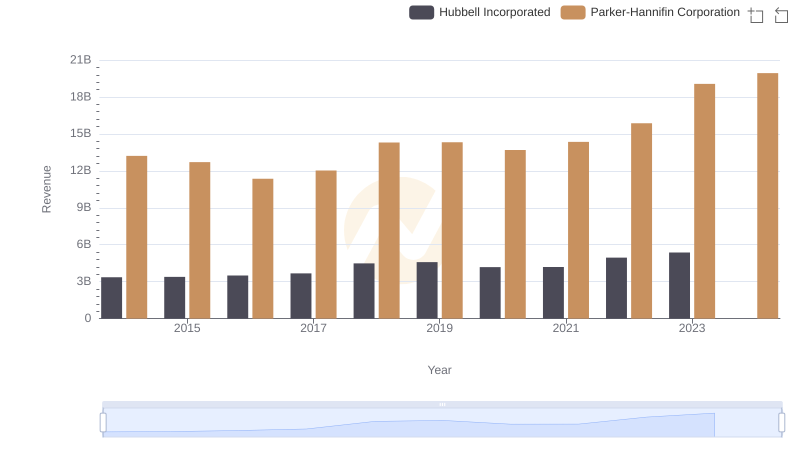
Parker-Hannifin Corporation or Hubbell Incorporated: Who Leads in Yearly Revenue?
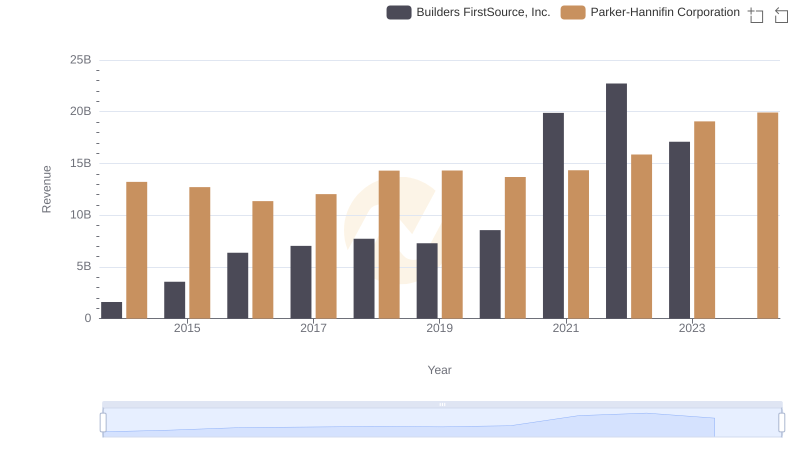
Annual Revenue Comparison: Parker-Hannifin Corporation vs Builders FirstSource, Inc.
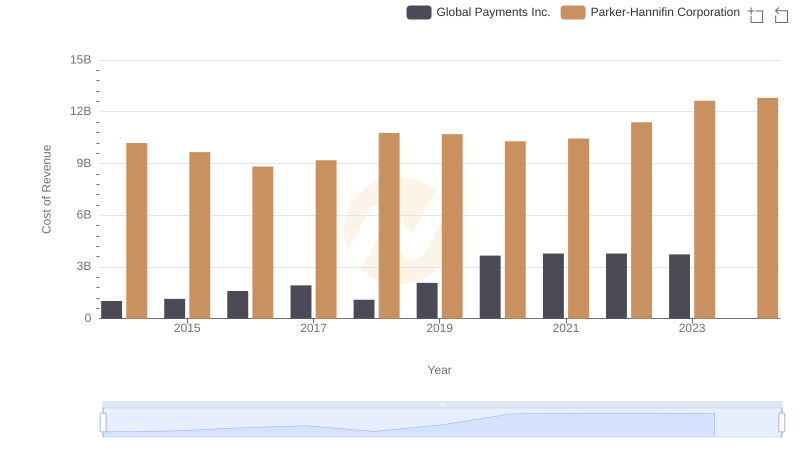
Cost Insights: Breaking Down Parker-Hannifin Corporation and Global Payments Inc.'s Expenses
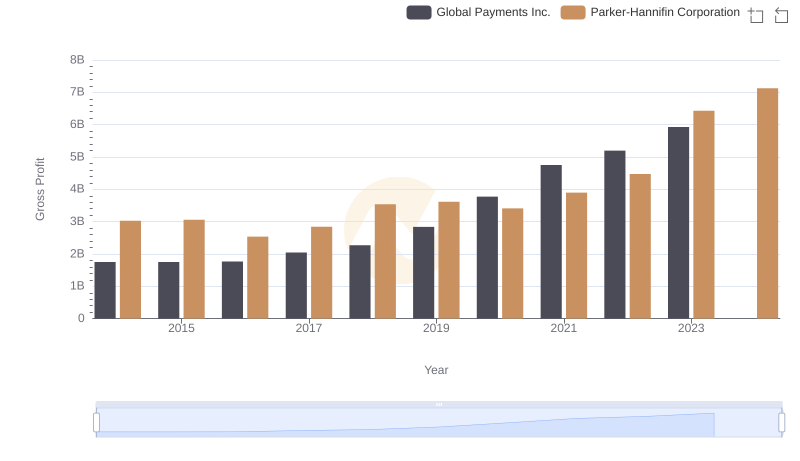
Gross Profit Comparison: Parker-Hannifin Corporation and Global Payments Inc. Trends
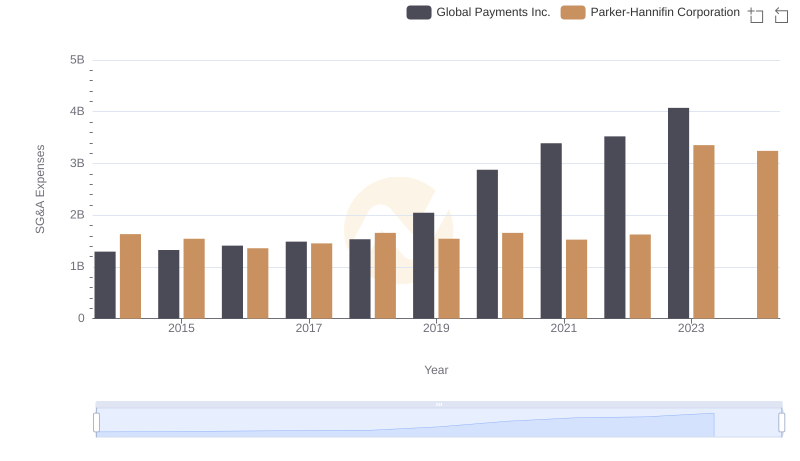
Parker-Hannifin Corporation vs Global Payments Inc.: SG&A Expense Trends
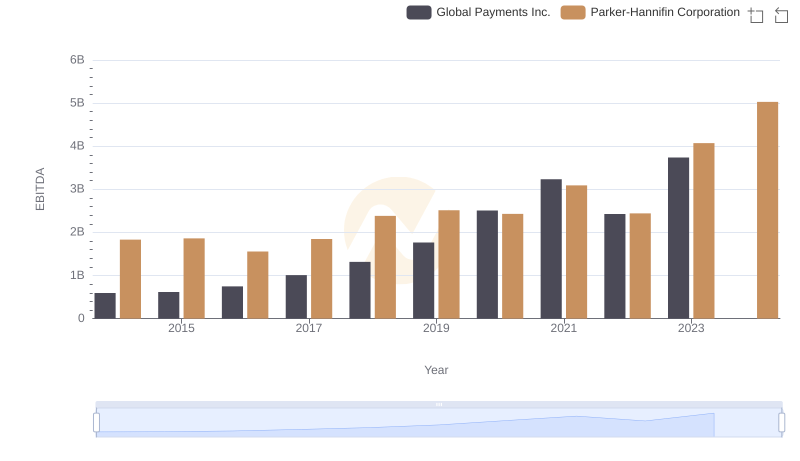
EBITDA Performance Review: Parker-Hannifin Corporation vs Global Payments Inc.