| __timestamp | Global Payments Inc. | Parker-Hannifin Corporation |
|---|---|---|
| Wednesday, January 1, 2014 | 1295014000 | 1633992000 |
| Thursday, January 1, 2015 | 1325567000 | 1544746000 |
| Friday, January 1, 2016 | 1411096000 | 1359360000 |
| Sunday, January 1, 2017 | 1488258000 | 1453935000 |
| Monday, January 1, 2018 | 1534297000 | 1657152000 |
| Tuesday, January 1, 2019 | 2046672000 | 1543939000 |
| Wednesday, January 1, 2020 | 2878878000 | 1656553000 |
| Friday, January 1, 2021 | 3391161000 | 1527302000 |
| Saturday, January 1, 2022 | 3524578000 | 1627116000 |
| Sunday, January 1, 2023 | 4073768000 | 3354103000 |
| Monday, January 1, 2024 | 4285307000 | 3315177000 |
In pursuit of knowledge
In the ever-evolving landscape of corporate finance, understanding the trends in Selling, General, and Administrative (SG&A) expenses is crucial for investors and analysts alike. Over the past decade, Parker-Hannifin Corporation and Global Payments Inc. have showcased distinct trajectories in their SG&A expenditures.
From 2014 to 2023, Global Payments Inc. saw a staggering 214% increase in SG&A expenses, peaking in 2023. This growth reflects the company's aggressive expansion and strategic investments. In contrast, Parker-Hannifin Corporation maintained a more stable trajectory, with a notable spike in 2023, marking a 105% increase from 2014. This suggests a strategic shift or significant investment during that year.
While Global Payments Inc. consistently increased its SG&A spending, Parker-Hannifin's expenses remained relatively stable until the recent surge. This divergence highlights differing corporate strategies and market responses. Missing data for 2024 suggests ongoing developments, warranting close observation.
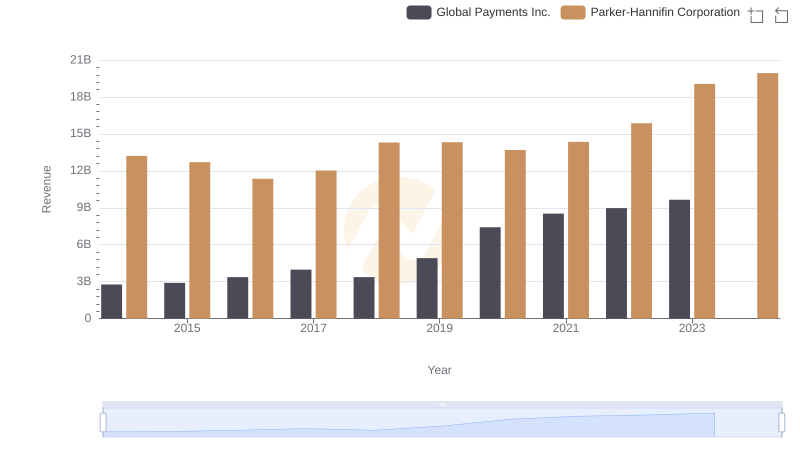
Annual Revenue Comparison: Parker-Hannifin Corporation vs Global Payments Inc.
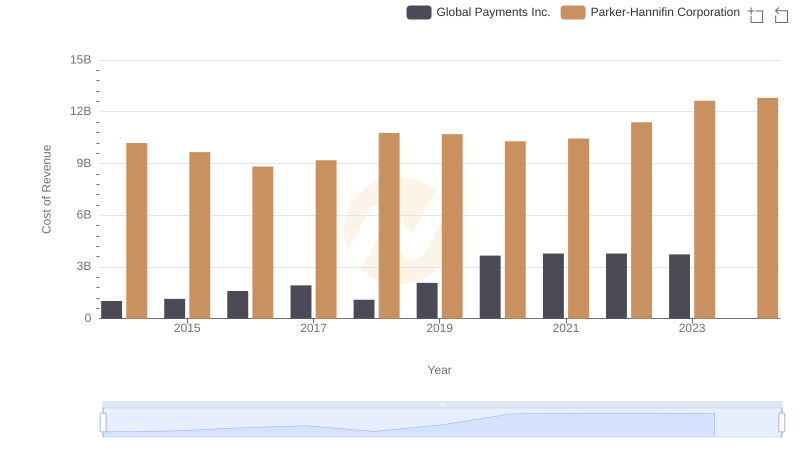
Cost Insights: Breaking Down Parker-Hannifin Corporation and Global Payments Inc.'s Expenses
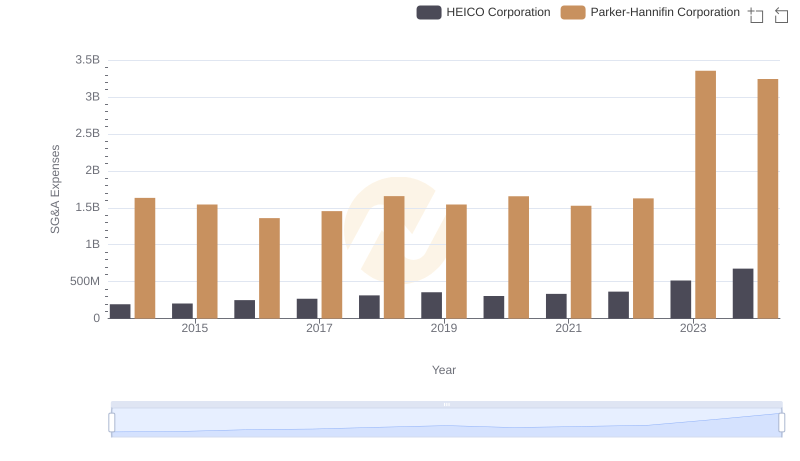
Breaking Down SG&A Expenses: Parker-Hannifin Corporation vs HEICO Corporation
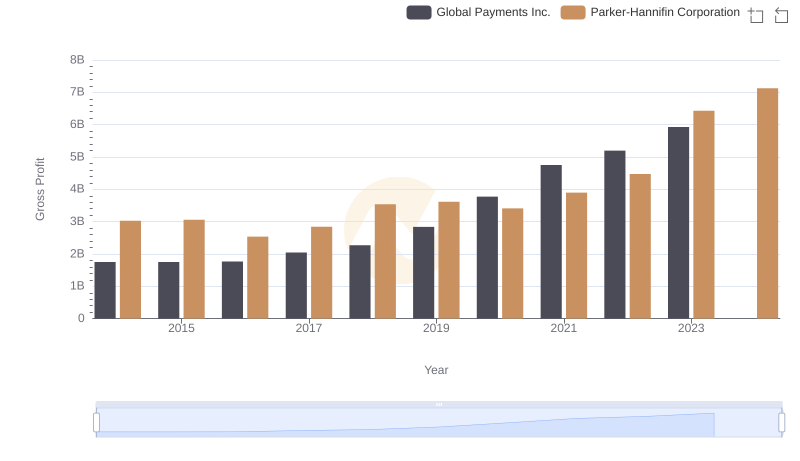
Gross Profit Comparison: Parker-Hannifin Corporation and Global Payments Inc. Trends
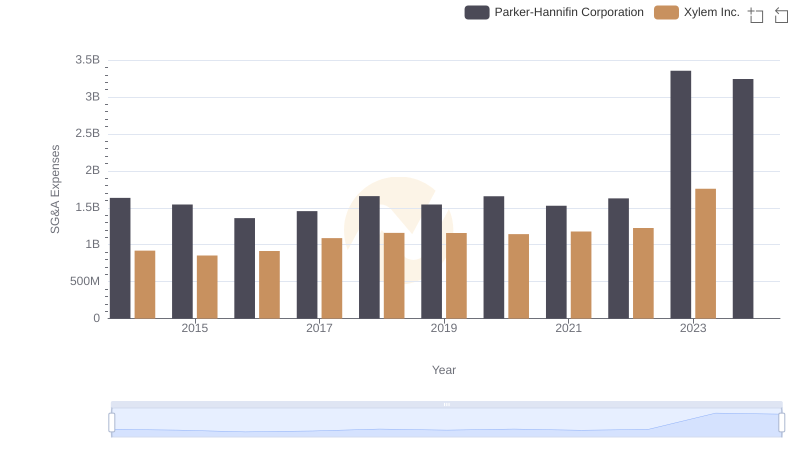
Cost Management Insights: SG&A Expenses for Parker-Hannifin Corporation and Xylem Inc.
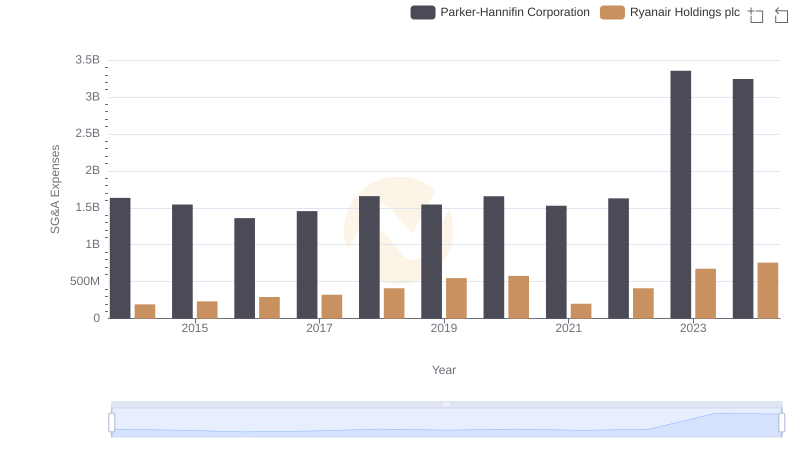
Parker-Hannifin Corporation and Ryanair Holdings plc: SG&A Spending Patterns Compared
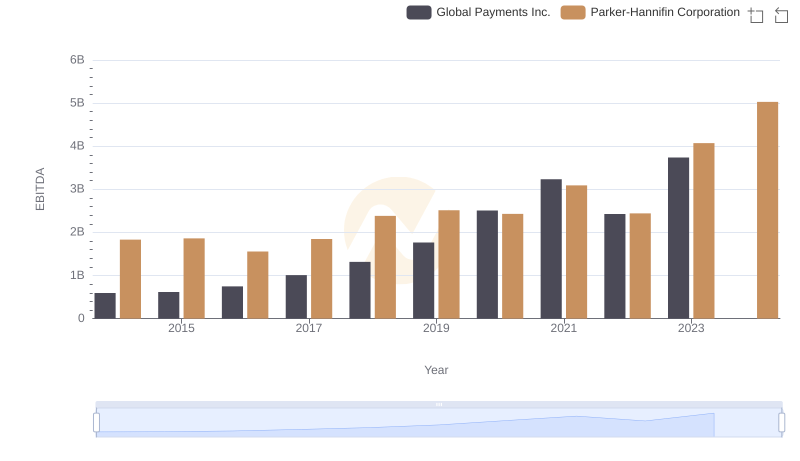
EBITDA Performance Review: Parker-Hannifin Corporation vs Global Payments Inc.
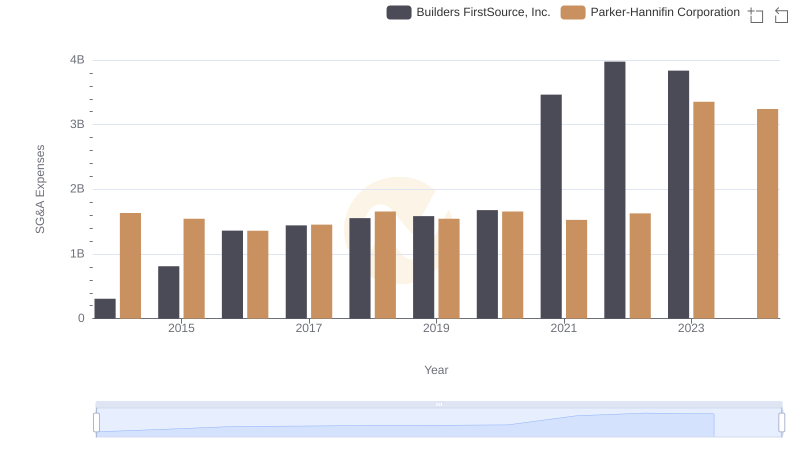
Comparing SG&A Expenses: Parker-Hannifin Corporation vs Builders FirstSource, Inc. Trends and Insights