| __timestamp | Global Payments Inc. | Parker-Hannifin Corporation |
|---|---|---|
| Wednesday, January 1, 2014 | 1022107000 | 10188227000 |
| Thursday, January 1, 2015 | 1147639000 | 9655245000 |
| Friday, January 1, 2016 | 1603532000 | 8823384000 |
| Sunday, January 1, 2017 | 1928037000 | 9188962000 |
| Monday, January 1, 2018 | 1095014000 | 10762841000 |
| Tuesday, January 1, 2019 | 2073803000 | 10703484000 |
| Wednesday, January 1, 2020 | 3650727000 | 10286518000 |
| Friday, January 1, 2021 | 3773725000 | 10449680000 |
| Saturday, January 1, 2022 | 3778617000 | 11387267000 |
| Sunday, January 1, 2023 | 3727521000 | 12635892000 |
| Monday, January 1, 2024 | 3760116000 | 12801816000 |
In pursuit of knowledge
In the ever-evolving landscape of industrial and financial sectors, understanding cost structures is pivotal. Parker-Hannifin Corporation, a leader in motion and control technologies, and Global Payments Inc., a titan in payment technology services, offer intriguing insights into their cost of revenue over the past decade.
From 2014 to 2023, Parker-Hannifin consistently maintained a higher cost of revenue, peaking at approximately $12.6 billion in 2023, marking a 24% increase from 2014. In contrast, Global Payments saw a more volatile trajectory, with costs surging by 265% from 2014 to 2023, reaching nearly $3.7 billion.
While Parker-Hannifin's data extends into 2024, Global Payments' figures for that year remain elusive, hinting at potential shifts in their financial strategies. This analysis underscores the importance of cost management in sustaining competitive advantage.
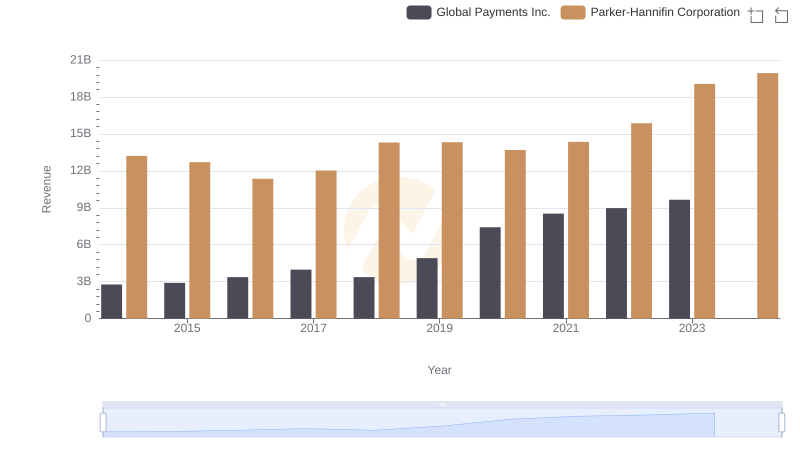
Annual Revenue Comparison: Parker-Hannifin Corporation vs Global Payments Inc.
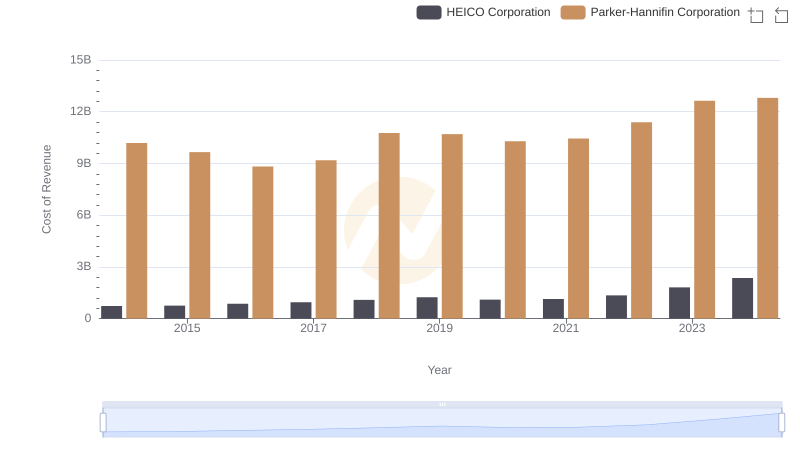
Cost of Revenue Comparison: Parker-Hannifin Corporation vs HEICO Corporation
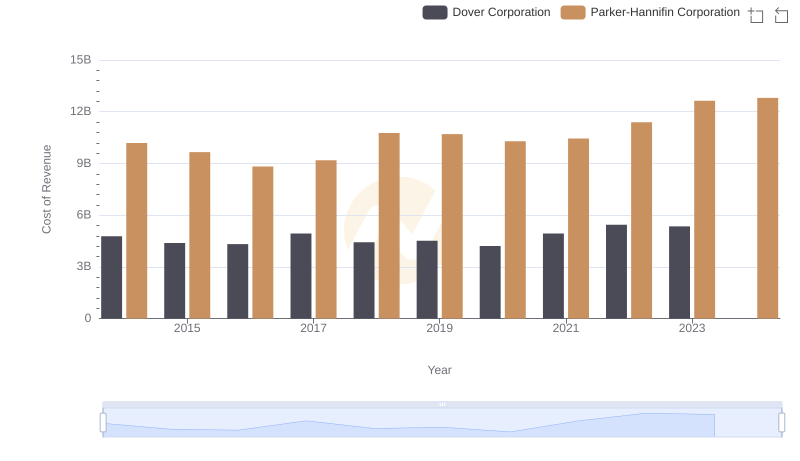
Cost Insights: Breaking Down Parker-Hannifin Corporation and Dover Corporation's Expenses
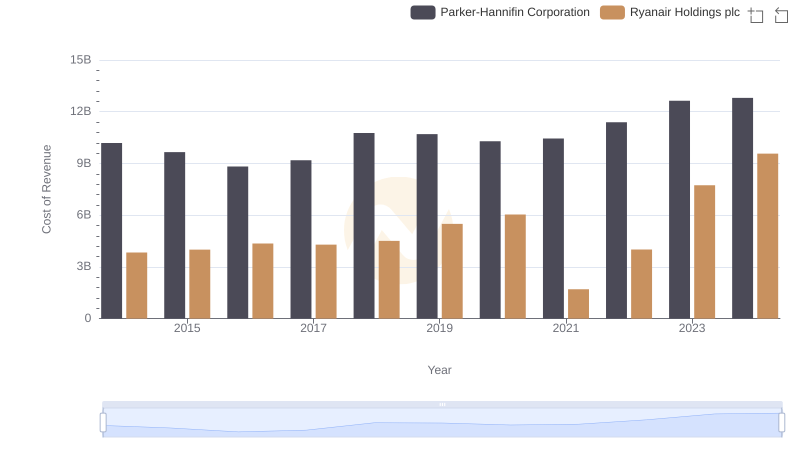
Cost Insights: Breaking Down Parker-Hannifin Corporation and Ryanair Holdings plc's Expenses
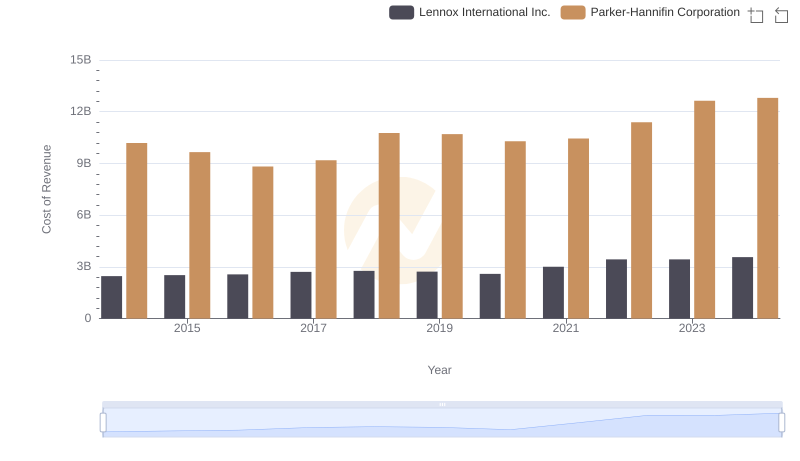
Analyzing Cost of Revenue: Parker-Hannifin Corporation and Lennox International Inc.

Analyzing Cost of Revenue: Parker-Hannifin Corporation and Builders FirstSource, Inc.
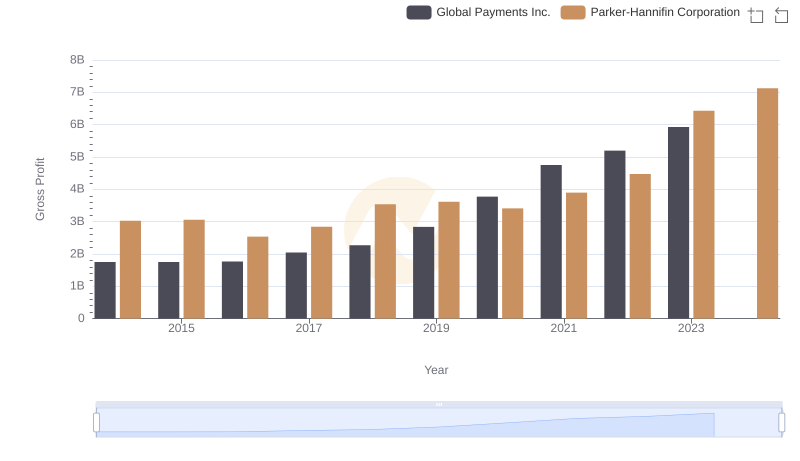
Gross Profit Comparison: Parker-Hannifin Corporation and Global Payments Inc. Trends
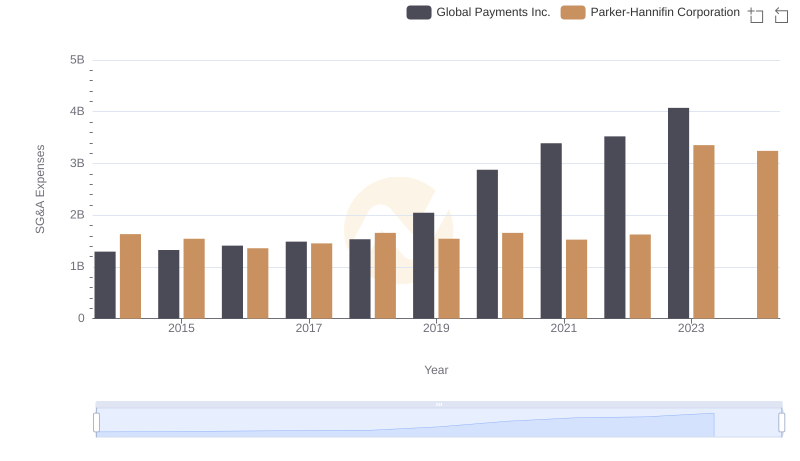
Parker-Hannifin Corporation vs Global Payments Inc.: SG&A Expense Trends
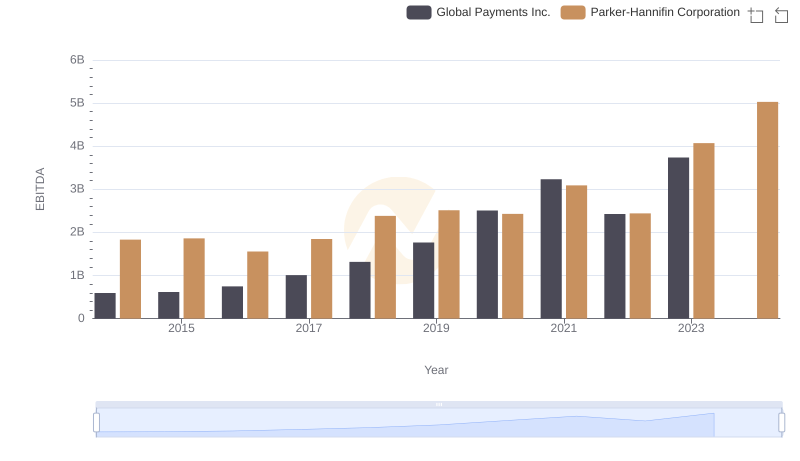
EBITDA Performance Review: Parker-Hannifin Corporation vs Global Payments Inc.