| __timestamp | Infosys Limited | NetEase, Inc. |
|---|---|---|
| Wednesday, January 1, 2014 | 3337000000 | 8451290000 |
| Thursday, January 1, 2015 | 3551000000 | 13403635000 |
| Friday, January 1, 2016 | 3762000000 | 21663812000 |
| Sunday, January 1, 2017 | 3938000000 | 25912693000 |
| Monday, January 1, 2018 | 4112000000 | 28403496000 |
| Tuesday, January 1, 2019 | 4228000000 | 31555300000 |
| Wednesday, January 1, 2020 | 4733000000 | 38983402000 |
| Friday, January 1, 2021 | 5315000000 | 46970801000 |
| Saturday, January 1, 2022 | 5503000000 | 52766126000 |
| Sunday, January 1, 2023 | 5466000000 | 63063394000 |
Unveiling the hidden dimensions of data
In the ever-evolving landscape of global business, the financial trajectories of Infosys Limited and NetEase, Inc. offer a fascinating study in contrasts. Over the past decade, from 2014 to 2023, these two industry titans have demonstrated remarkable growth in gross profit, albeit at different scales and paces.
Infosys Limited, a stalwart in the IT services sector, has seen its gross profit grow by approximately 64%, from $3.3 billion in 2014 to $5.5 billion in 2023. This steady ascent underscores its robust business model and strategic market positioning.
Meanwhile, NetEase, Inc., a leader in the internet technology space, has experienced a staggering 646% increase in gross profit, soaring from $8.5 billion to $63 billion over the same period. This explosive growth highlights the dynamic nature of the tech industry and NetEase's ability to capitalize on emerging digital trends.
These trends not only reflect the companies' individual strengths but also the broader economic shifts influencing their respective industries.
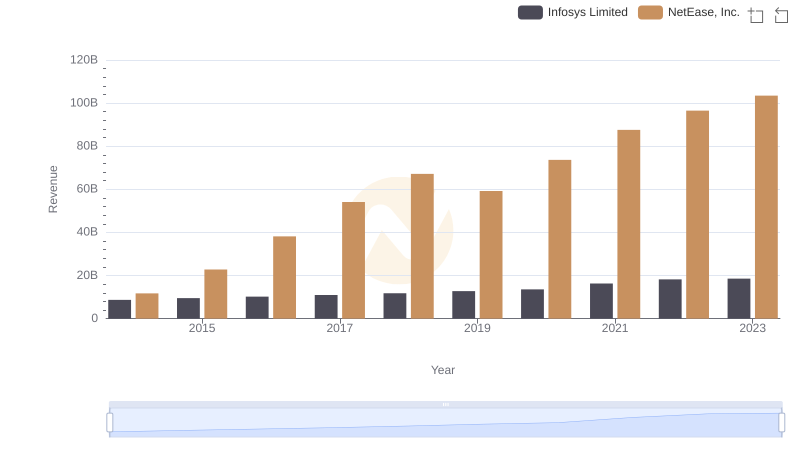
Infosys Limited vs NetEase, Inc.: Examining Key Revenue Metrics
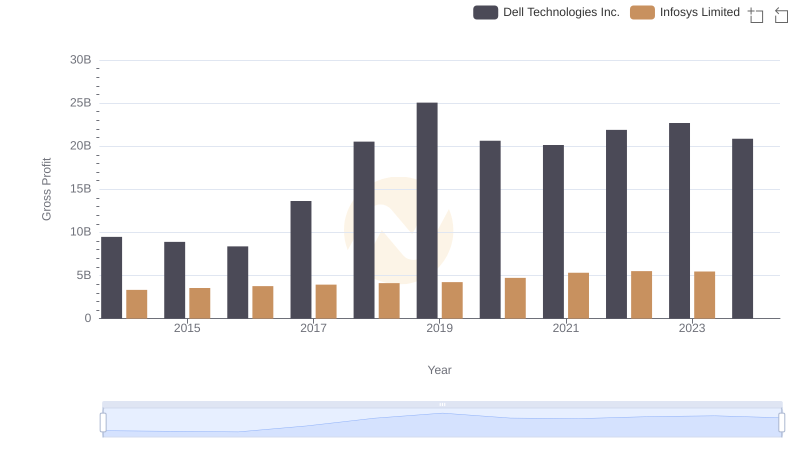
Gross Profit Trends Compared: Infosys Limited vs Dell Technologies Inc.
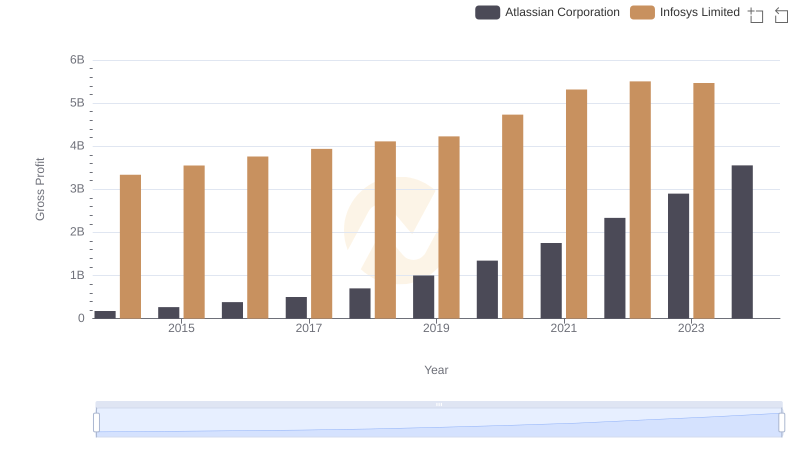
Gross Profit Comparison: Infosys Limited and Atlassian Corporation Trends
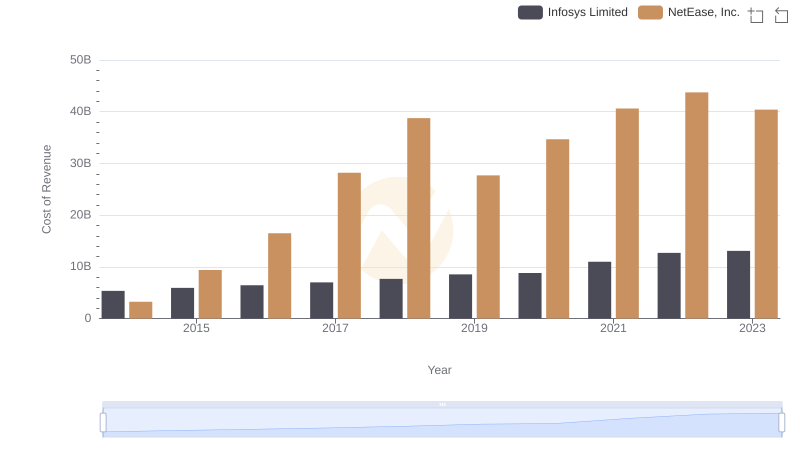
Cost of Revenue Trends: Infosys Limited vs NetEase, Inc.
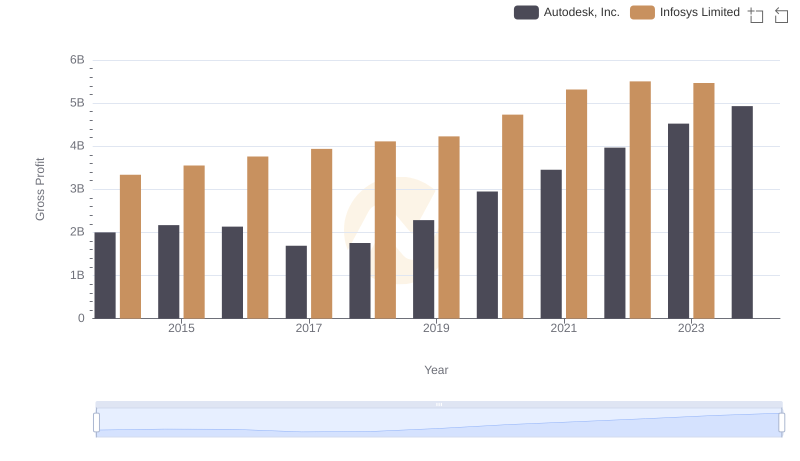
Gross Profit Comparison: Infosys Limited and Autodesk, Inc. Trends
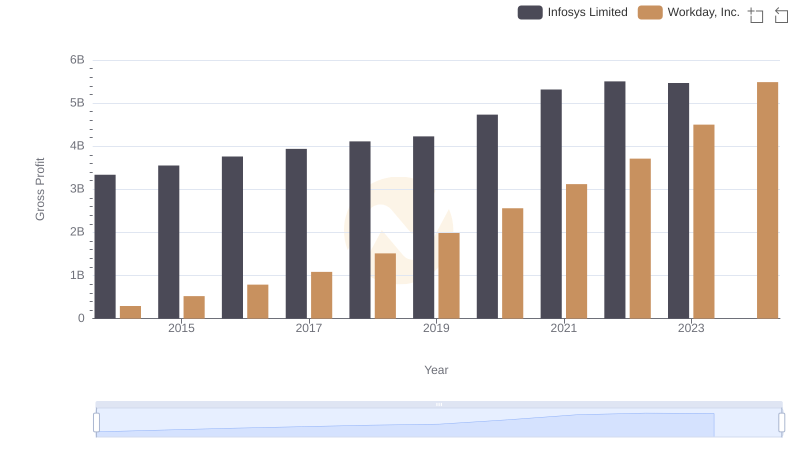
Key Insights on Gross Profit: Infosys Limited vs Workday, Inc.
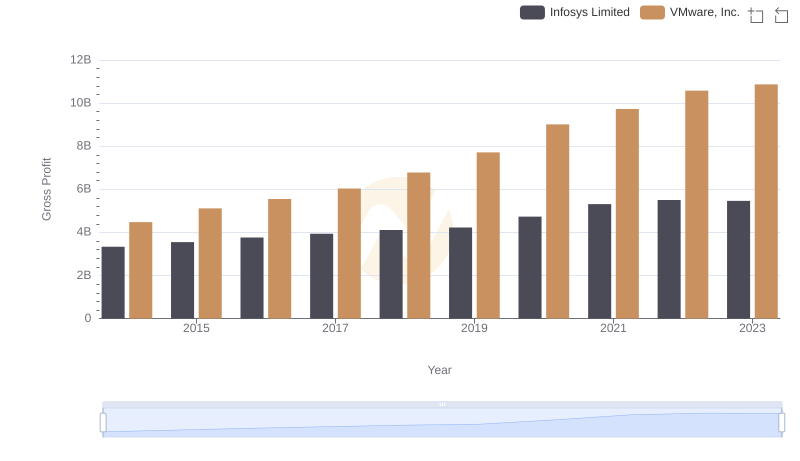
Gross Profit Trends Compared: Infosys Limited vs VMware, Inc.
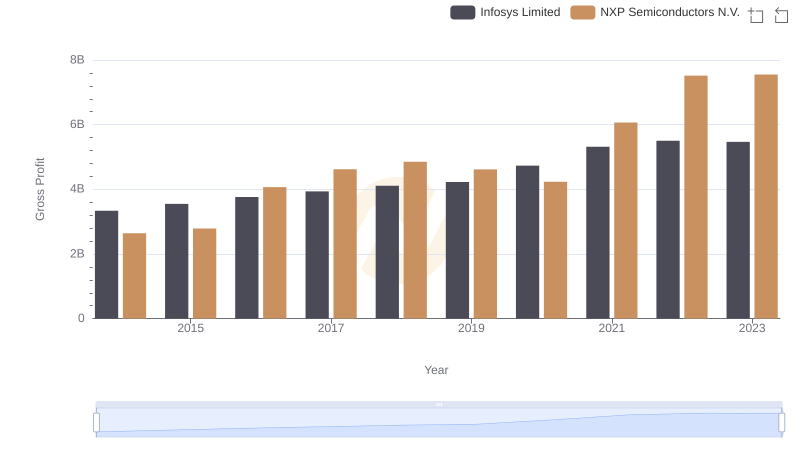
Gross Profit Analysis: Comparing Infosys Limited and NXP Semiconductors N.V.
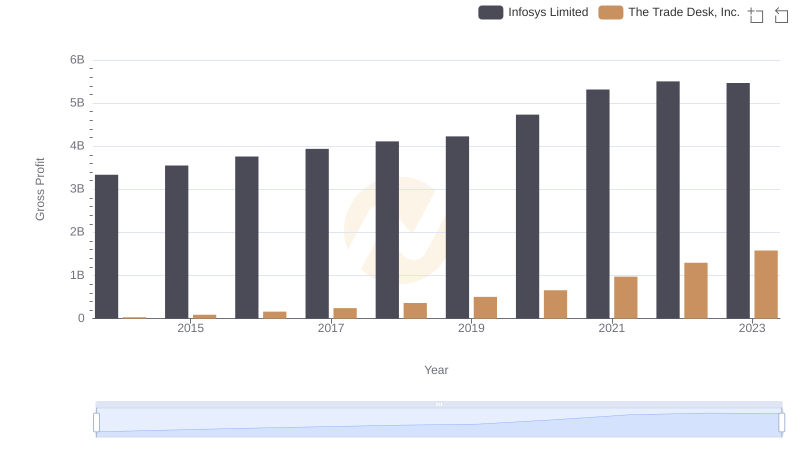
Key Insights on Gross Profit: Infosys Limited vs The Trade Desk, Inc.
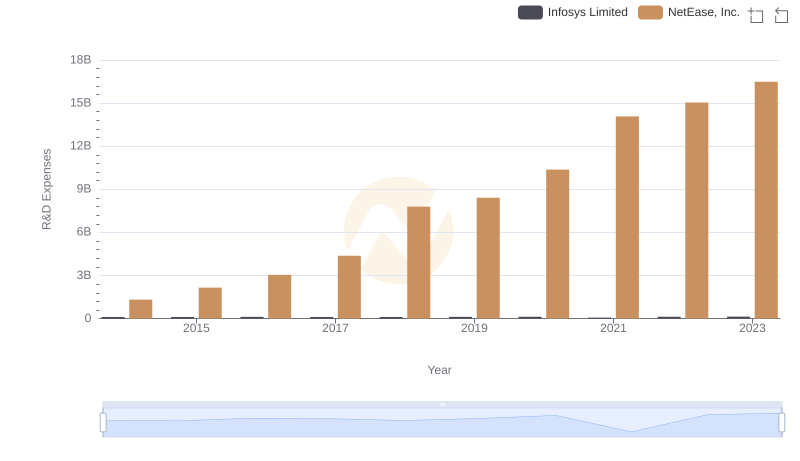
Infosys Limited or NetEase, Inc.: Who Invests More in Innovation?
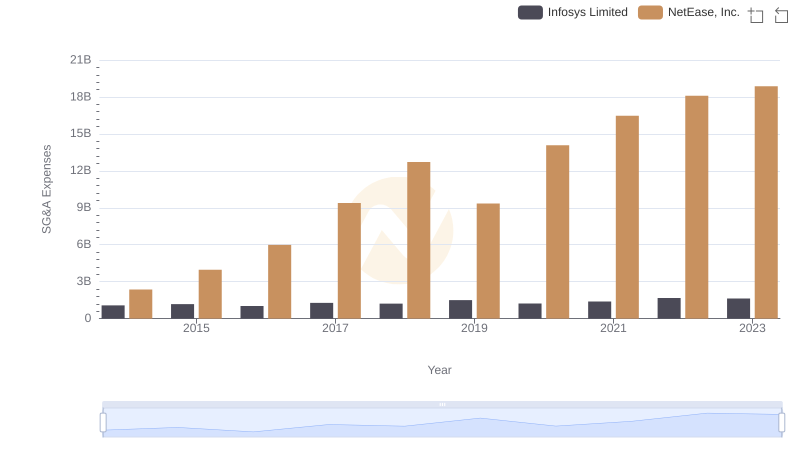
Cost Management Insights: SG&A Expenses for Infosys Limited and NetEase, Inc.
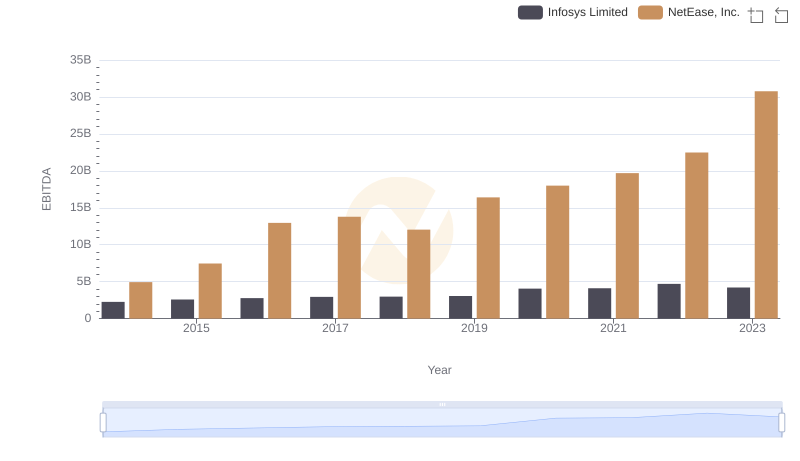
A Side-by-Side Analysis of EBITDA: Infosys Limited and NetEase, Inc.