| __timestamp | Atlassian Corporation | Infosys Limited |
|---|---|---|
| Wednesday, January 1, 2014 | 177123000 | 3337000000 |
| Thursday, January 1, 2015 | 266589000 | 3551000000 |
| Friday, January 1, 2016 | 381275000 | 3762000000 |
| Sunday, January 1, 2017 | 500775000 | 3938000000 |
| Monday, January 1, 2018 | 701260000 | 4112000000 |
| Tuesday, January 1, 2019 | 999842000 | 4228000000 |
| Wednesday, January 1, 2020 | 1345366000 | 4733000000 |
| Friday, January 1, 2021 | 1753111000 | 5315000000 |
| Saturday, January 1, 2022 | 2337175000 | 5503000000 |
| Sunday, January 1, 2023 | 2900882000 | 5466000000 |
| Monday, January 1, 2024 | 3555108000 |
Cracking the code
In the ever-evolving landscape of global technology, the financial trajectories of Infosys Limited and Atlassian Corporation offer a fascinating study. Over the past decade, Infosys has consistently demonstrated robust growth, with its gross profit peaking at approximately 5.5 billion in 2022, marking a 65% increase from 2014. Meanwhile, Atlassian's journey is equally compelling, showcasing a staggering 1,900% growth from 2014 to 2024, with its gross profit reaching around 3.6 billion.
While Infosys's growth has been steady, Atlassian's rapid ascent highlights its aggressive market expansion and innovative strategies. The data from 2023 reveals a narrowing gap between the two, with Atlassian's gross profit nearing Infosys's figures. However, the absence of data for Infosys in 2024 leaves room for speculation on its future trajectory. This comparison underscores the dynamic nature of the tech industry, where adaptability and innovation are key to sustained success.
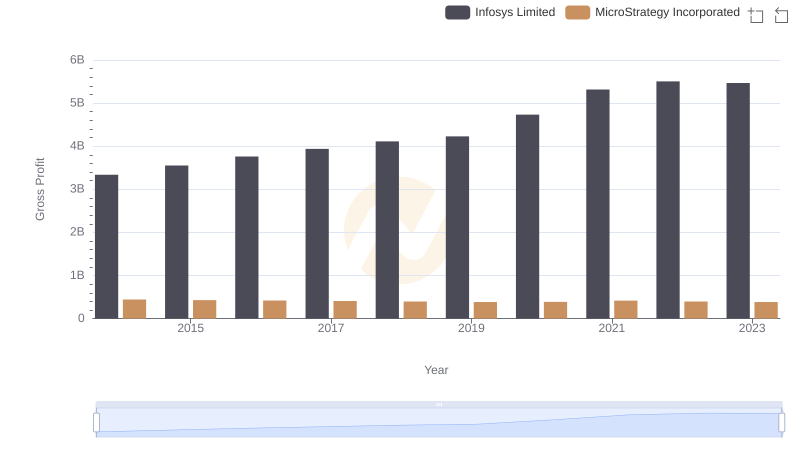
Who Generates Higher Gross Profit? Infosys Limited or MicroStrategy Incorporated
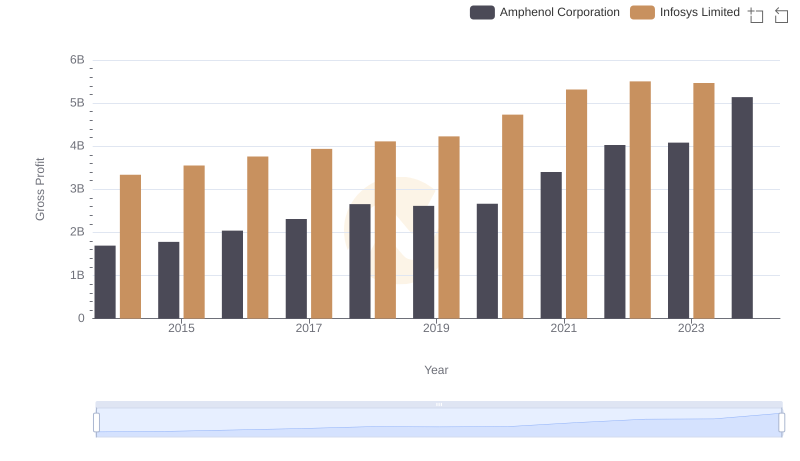
Infosys Limited vs Amphenol Corporation: A Gross Profit Performance Breakdown
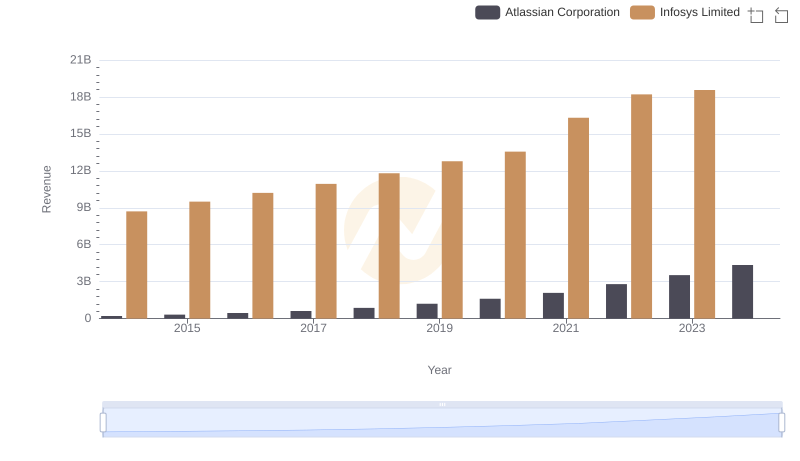
Revenue Showdown: Infosys Limited vs Atlassian Corporation
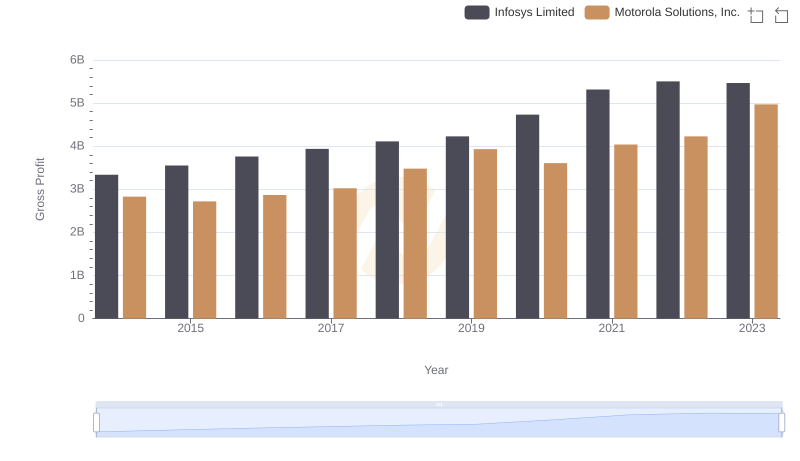
Who Generates Higher Gross Profit? Infosys Limited or Motorola Solutions, Inc.
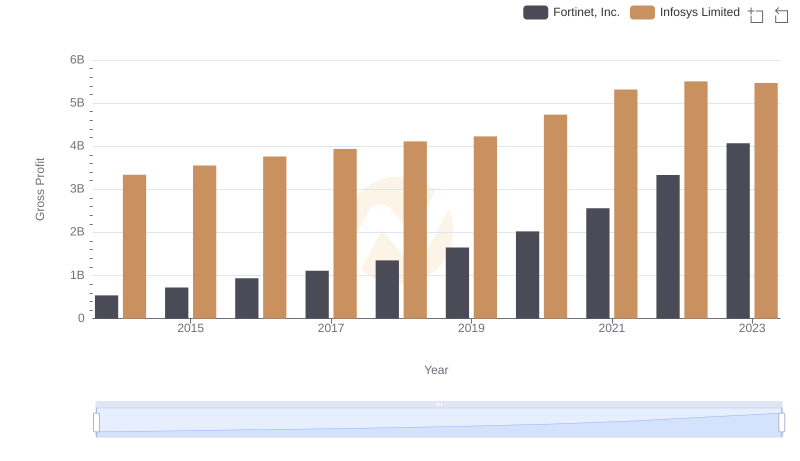
Infosys Limited vs Fortinet, Inc.: A Gross Profit Performance Breakdown
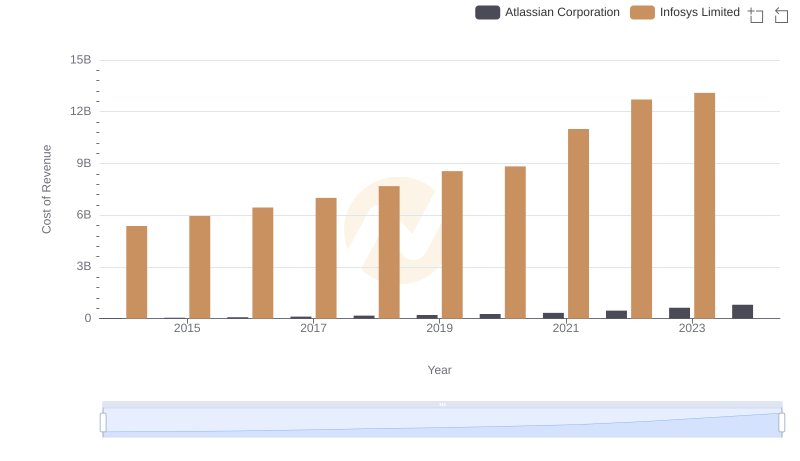
Analyzing Cost of Revenue: Infosys Limited and Atlassian Corporation
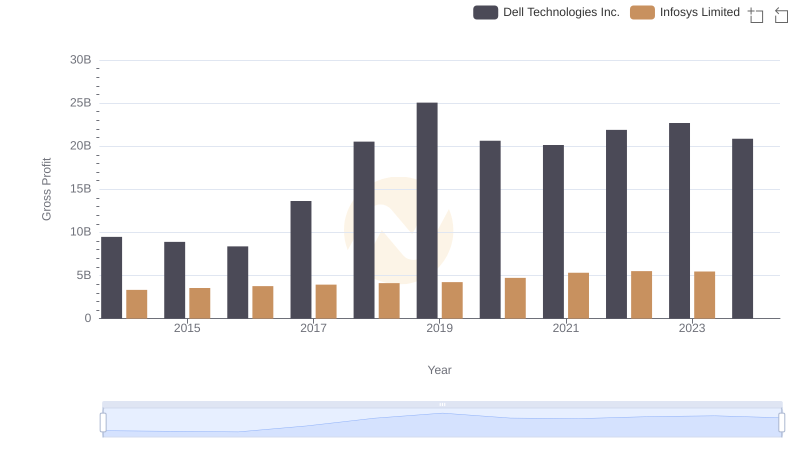
Gross Profit Trends Compared: Infosys Limited vs Dell Technologies Inc.
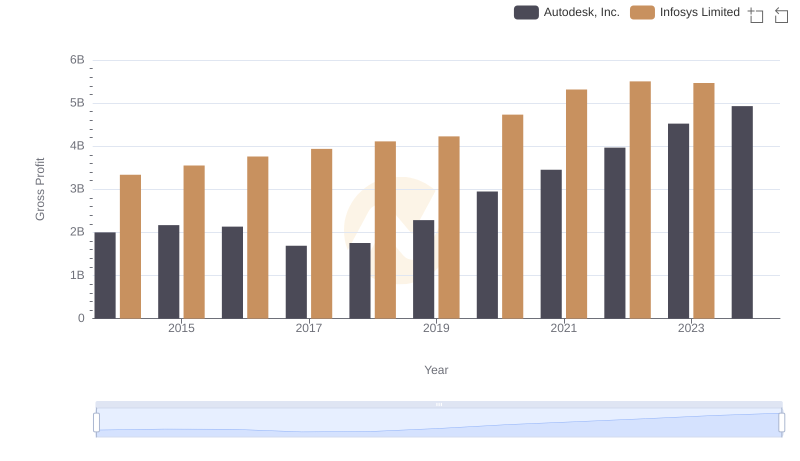
Gross Profit Comparison: Infosys Limited and Autodesk, Inc. Trends
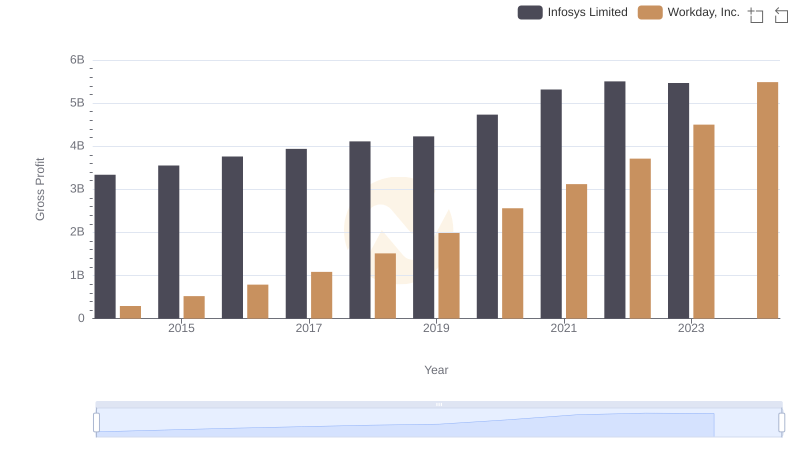
Key Insights on Gross Profit: Infosys Limited vs Workday, Inc.
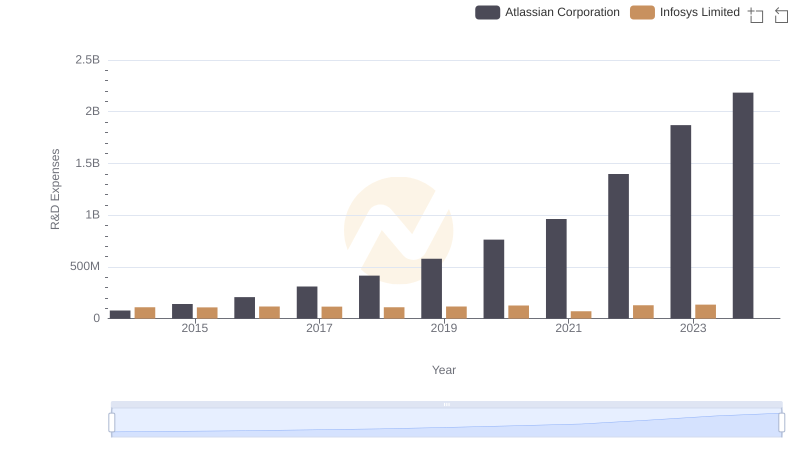
R&D Spending Showdown: Infosys Limited vs Atlassian Corporation
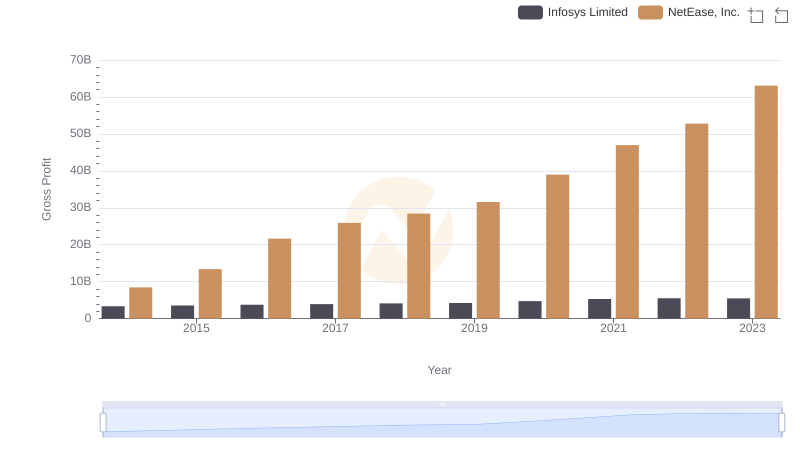
Gross Profit Comparison: Infosys Limited and NetEase, Inc. Trends
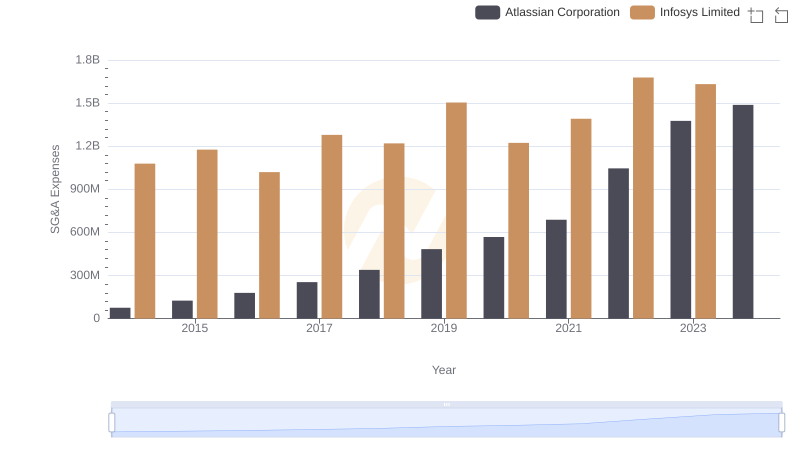
Breaking Down SG&A Expenses: Infosys Limited vs Atlassian Corporation