| __timestamp | Infosys Limited | Workday, Inc. |
|---|---|---|
| Wednesday, January 1, 2014 | 3337000000 | 292128000 |
| Thursday, January 1, 2015 | 3551000000 | 523057000 |
| Friday, January 1, 2016 | 3762000000 | 787919000 |
| Sunday, January 1, 2017 | 3938000000 | 1085862000 |
| Monday, January 1, 2018 | 4112000000 | 1513637000 |
| Tuesday, January 1, 2019 | 4228000000 | 1987230000 |
| Wednesday, January 1, 2020 | 4733000000 | 2561948000 |
| Friday, January 1, 2021 | 5315000000 | 3119864000 |
| Saturday, January 1, 2022 | 5503000000 | 3710703000 |
| Sunday, January 1, 2023 | 5466000000 | 4500640000 |
| Monday, January 1, 2024 | 5488000000 |
Unveiling the hidden dimensions of data
In the ever-evolving landscape of global technology, the financial performance of industry giants like Infosys Limited and Workday, Inc. offers a fascinating glimpse into their growth trajectories. From 2014 to 2023, Infosys Limited has consistently demonstrated robust growth, with its gross profit surging by approximately 64%, from $3.3 billion to $5.5 billion. This steady climb underscores Infosys's strategic prowess in maintaining its competitive edge.
Conversely, Workday, Inc. has exhibited a remarkable growth trajectory, with its gross profit skyrocketing by over 1,400% during the same period, from a modest $292 million to an impressive $4.5 billion. This exponential growth highlights Workday's aggressive expansion and increasing market penetration.
While Infosys's data for 2024 remains unavailable, Workday's projected gross profit of $5.5 billion suggests its upward momentum is set to continue. These insights provide a compelling narrative of two tech titans navigating the complexities of the global market.
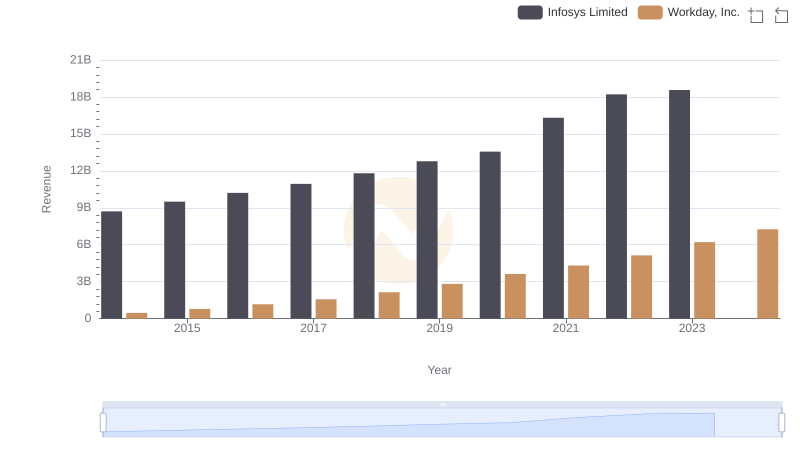
Revenue Showdown: Infosys Limited vs Workday, Inc.
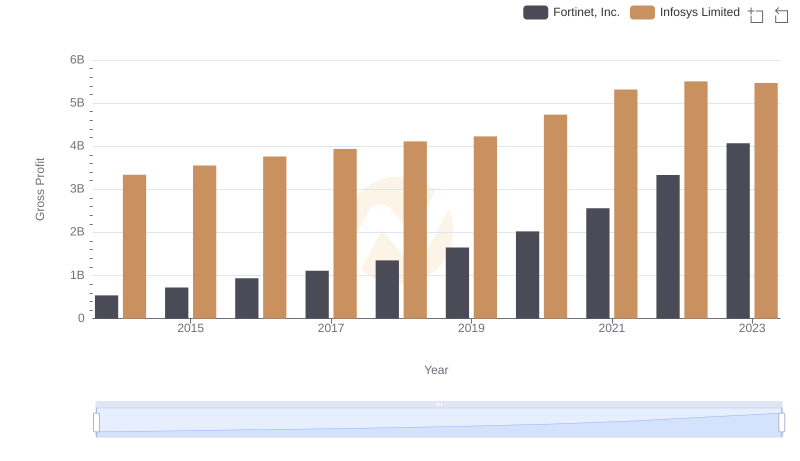
Infosys Limited vs Fortinet, Inc.: A Gross Profit Performance Breakdown
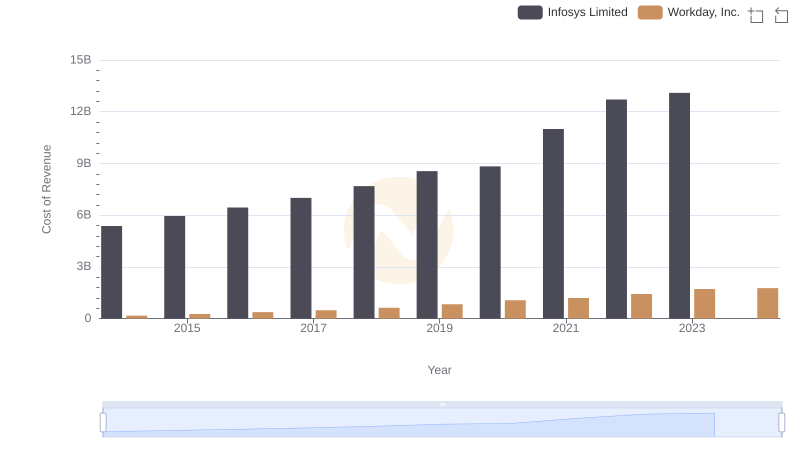
Cost of Revenue Trends: Infosys Limited vs Workday, Inc.
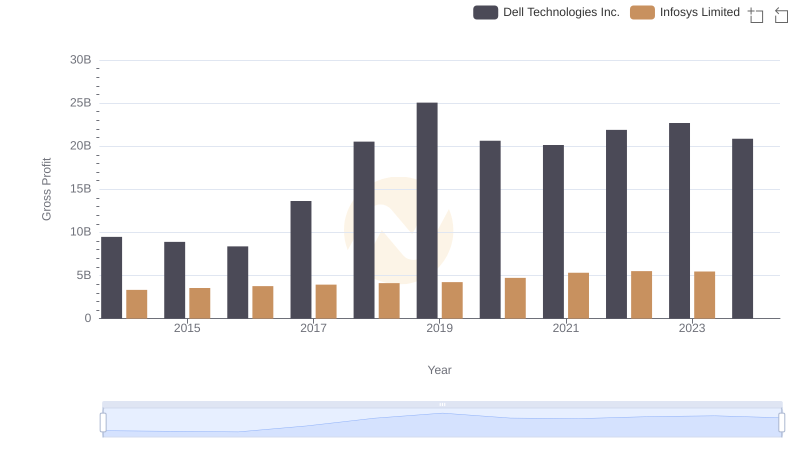
Gross Profit Trends Compared: Infosys Limited vs Dell Technologies Inc.
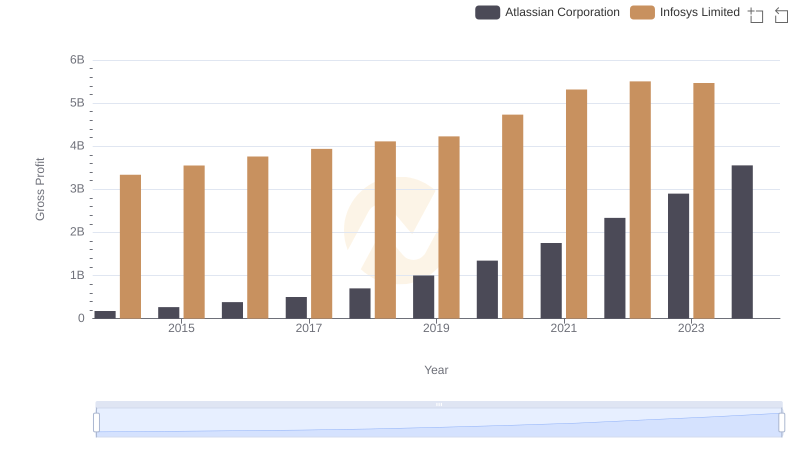
Gross Profit Comparison: Infosys Limited and Atlassian Corporation Trends
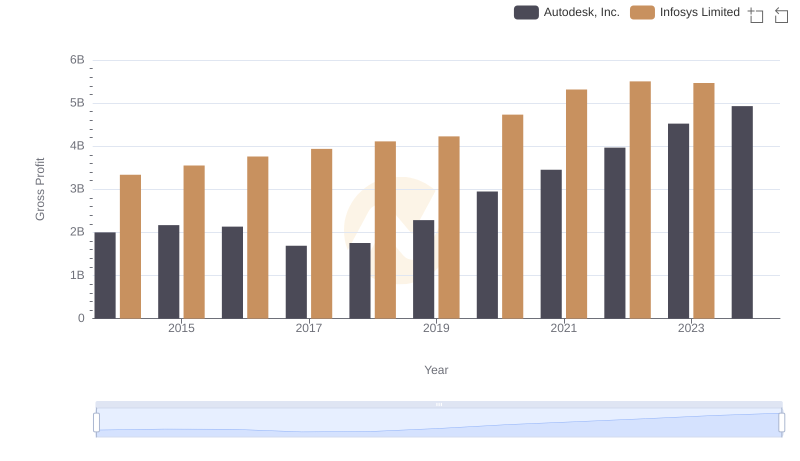
Gross Profit Comparison: Infosys Limited and Autodesk, Inc. Trends
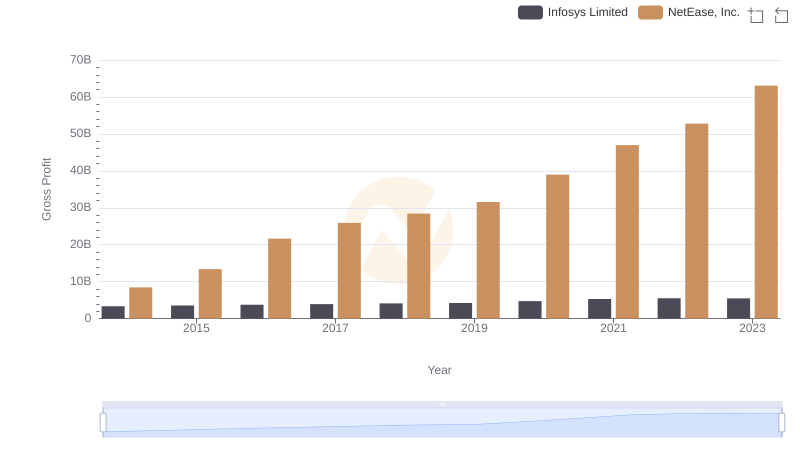
Gross Profit Comparison: Infosys Limited and NetEase, Inc. Trends
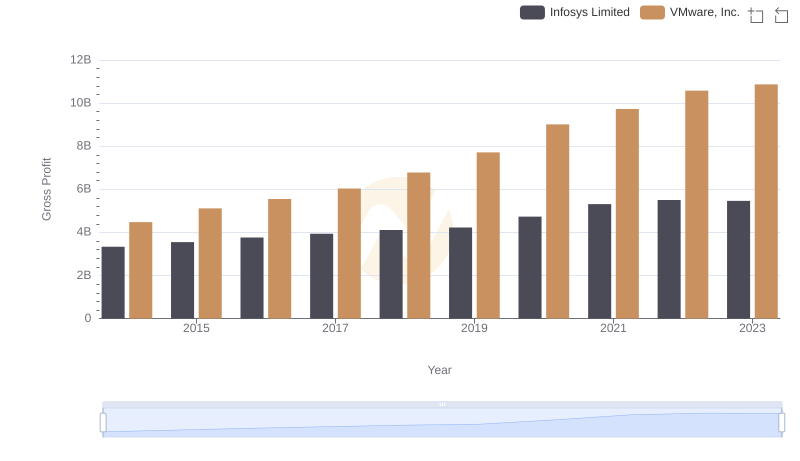
Gross Profit Trends Compared: Infosys Limited vs VMware, Inc.
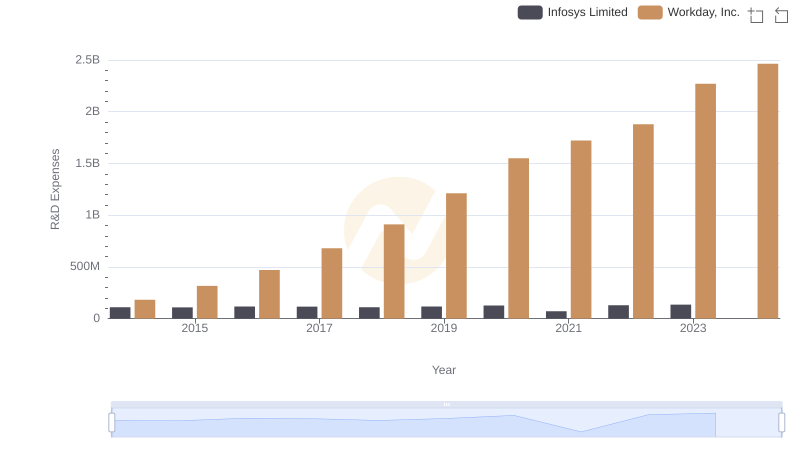
Infosys Limited vs Workday, Inc.: Strategic Focus on R&D Spending
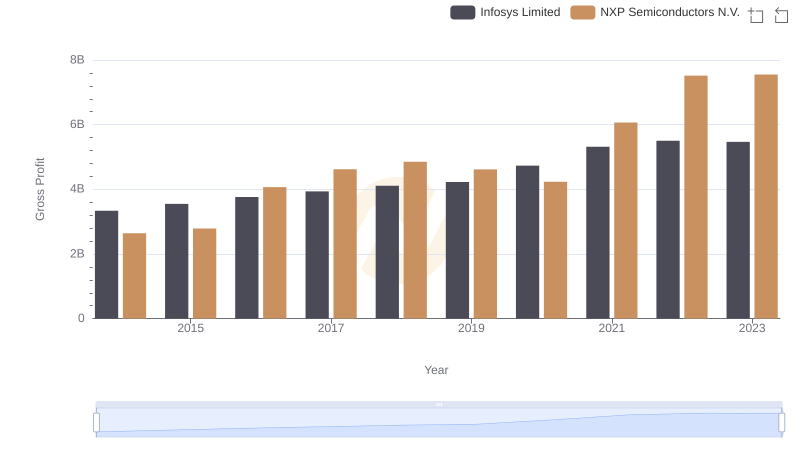
Gross Profit Analysis: Comparing Infosys Limited and NXP Semiconductors N.V.
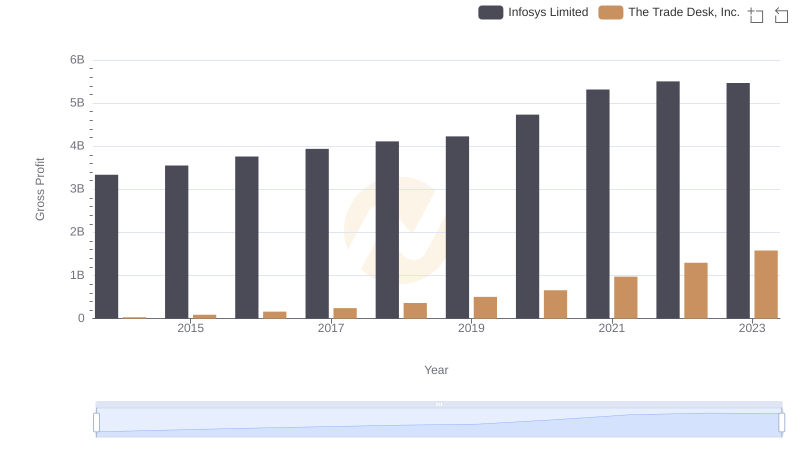
Key Insights on Gross Profit: Infosys Limited vs The Trade Desk, Inc.
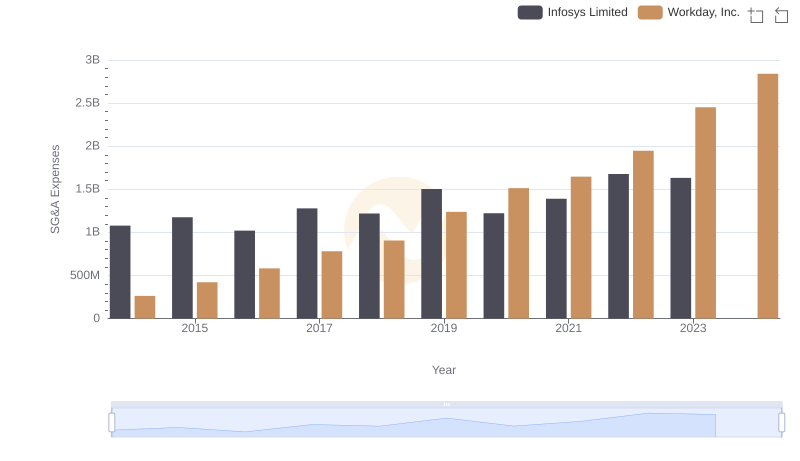
Operational Costs Compared: SG&A Analysis of Infosys Limited and Workday, Inc.