| __timestamp | Autodesk, Inc. | Infosys Limited |
|---|---|---|
| Wednesday, January 1, 2014 | 1999600000 | 3337000000 |
| Thursday, January 1, 2015 | 2170100000 | 3551000000 |
| Friday, January 1, 2016 | 2133400000 | 3762000000 |
| Sunday, January 1, 2017 | 1689100000 | 3938000000 |
| Monday, January 1, 2018 | 1753200000 | 4112000000 |
| Tuesday, January 1, 2019 | 2283900000 | 4228000000 |
| Wednesday, January 1, 2020 | 2949400000 | 4733000000 |
| Friday, January 1, 2021 | 3453300000 | 5315000000 |
| Saturday, January 1, 2022 | 3967900000 | 5503000000 |
| Sunday, January 1, 2023 | 4525000000 | 5466000000 |
| Monday, January 1, 2024 | 4977000000 |
Unveiling the hidden dimensions of data
In the ever-evolving landscape of global business, understanding the financial health of industry leaders is crucial. This analysis delves into the gross profit trends of two giants: Infosys Limited and Autodesk, Inc., from 2014 to 2023. Over this decade, Infosys consistently outperformed Autodesk in terms of gross profit, with a peak in 2022 where Infosys achieved a gross profit approximately 40% higher than Autodesk. However, Autodesk demonstrated a remarkable growth trajectory, with its gross profit more than doubling from 2014 to 2023, showcasing a robust annual growth rate. Notably, 2023 marked a year of convergence, with Autodesk closing the gap significantly. The data for 2024 is incomplete, highlighting the dynamic nature of financial forecasting. This comparison underscores the resilience and adaptability of these companies in a competitive market.
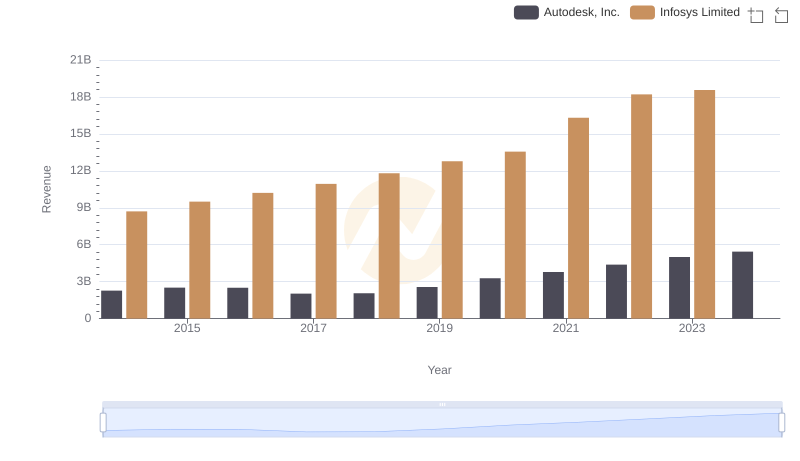
Infosys Limited vs Autodesk, Inc.: Examining Key Revenue Metrics
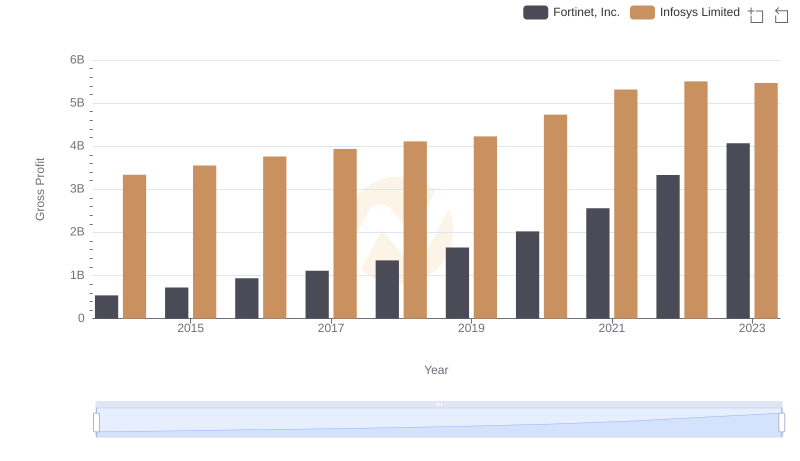
Infosys Limited vs Fortinet, Inc.: A Gross Profit Performance Breakdown
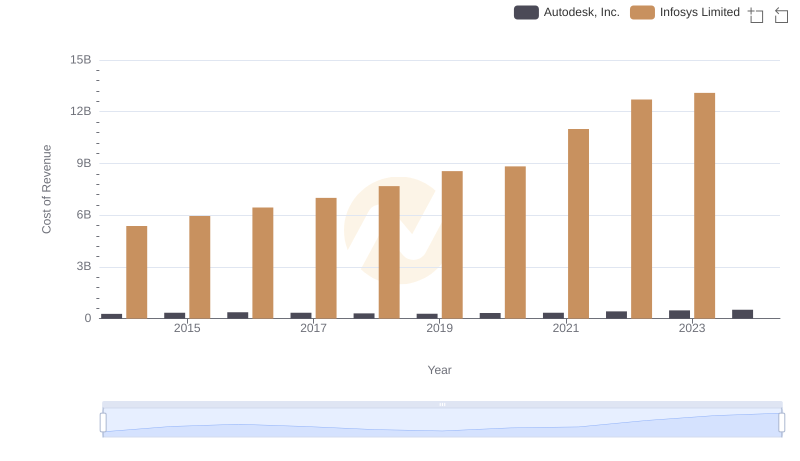
Analyzing Cost of Revenue: Infosys Limited and Autodesk, Inc.
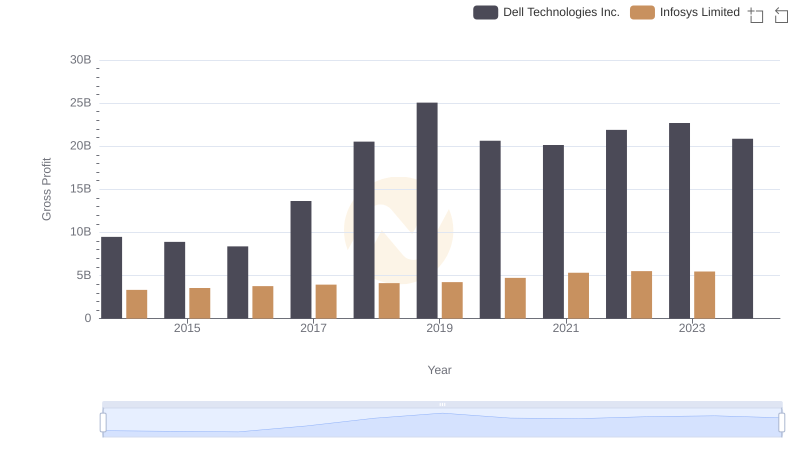
Gross Profit Trends Compared: Infosys Limited vs Dell Technologies Inc.
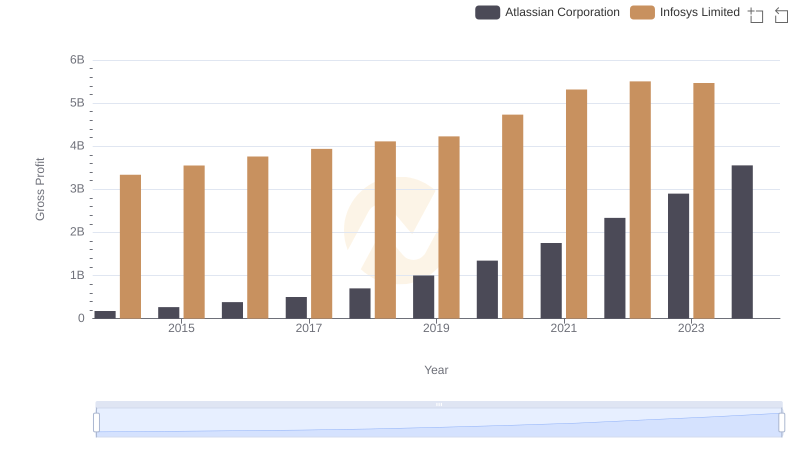
Gross Profit Comparison: Infosys Limited and Atlassian Corporation Trends
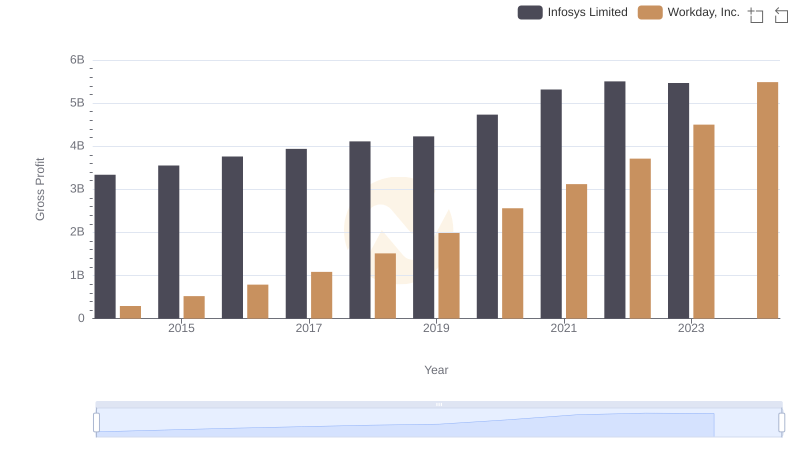
Key Insights on Gross Profit: Infosys Limited vs Workday, Inc.
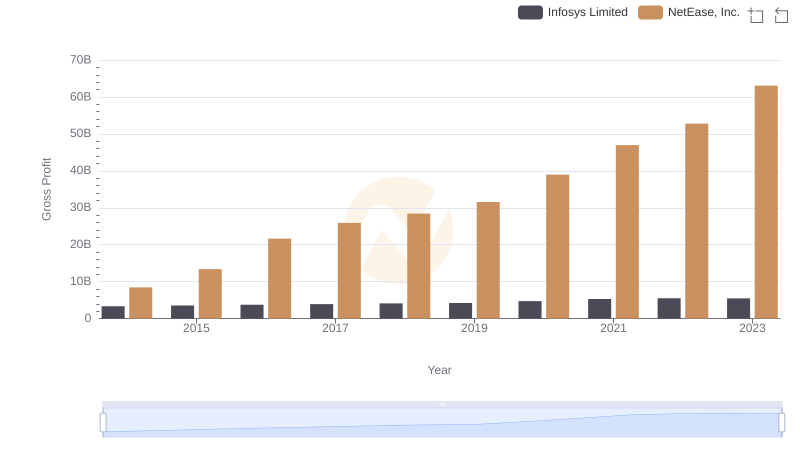
Gross Profit Comparison: Infosys Limited and NetEase, Inc. Trends
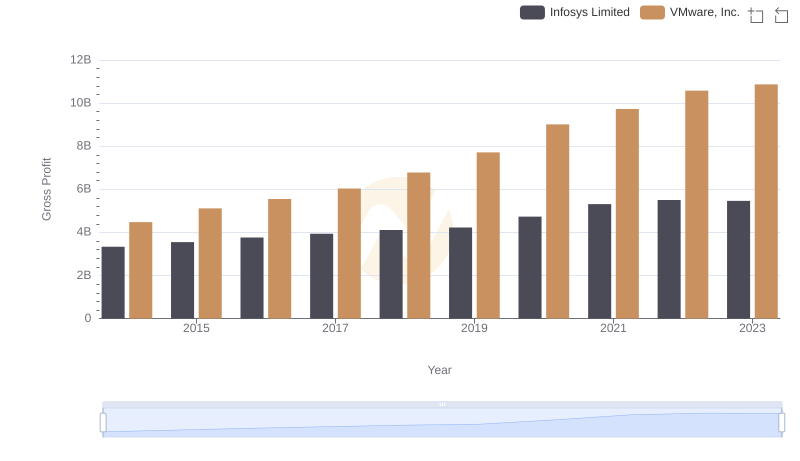
Gross Profit Trends Compared: Infosys Limited vs VMware, Inc.
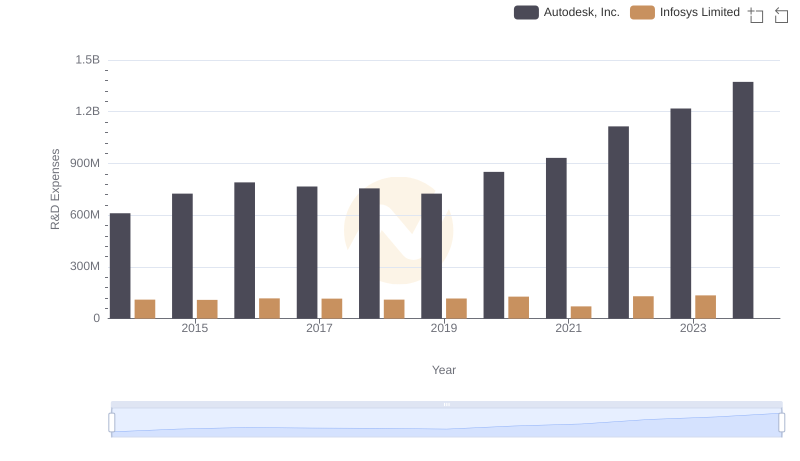
Who Prioritizes Innovation? R&D Spending Compared for Infosys Limited and Autodesk, Inc.
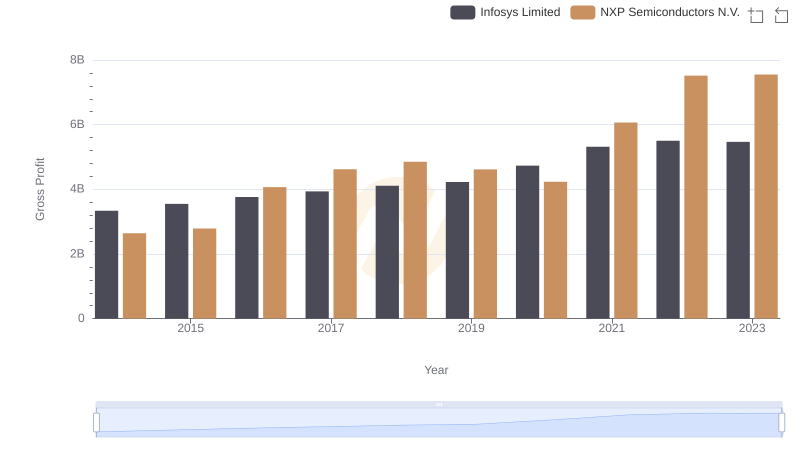
Gross Profit Analysis: Comparing Infosys Limited and NXP Semiconductors N.V.
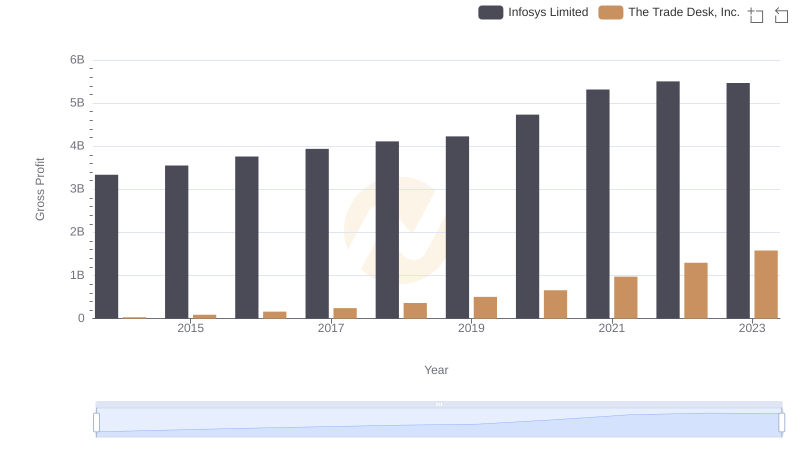
Key Insights on Gross Profit: Infosys Limited vs The Trade Desk, Inc.
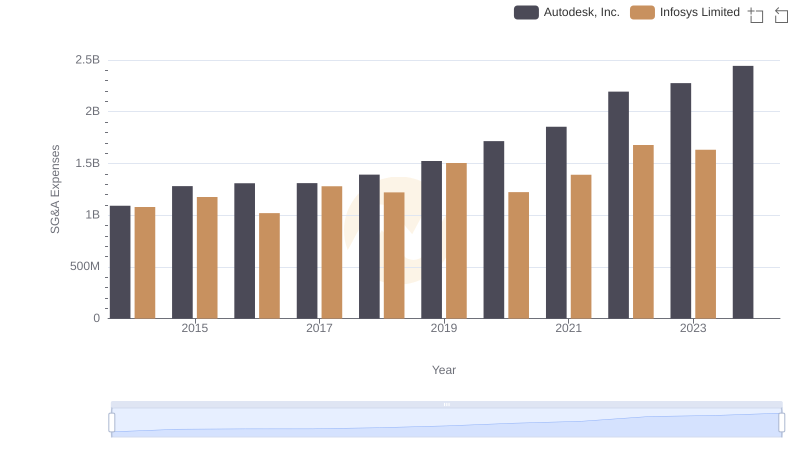
Infosys Limited and Autodesk, Inc.: SG&A Spending Patterns Compared