| __timestamp | Infosys Limited | NetEase, Inc. |
|---|---|---|
| Wednesday, January 1, 2014 | 5374000000 | 3261544000 |
| Thursday, January 1, 2015 | 5950000000 | 9399260000 |
| Friday, January 1, 2016 | 6446000000 | 16515032000 |
| Sunday, January 1, 2017 | 7001000000 | 28189326000 |
| Monday, January 1, 2018 | 7687000000 | 38752957000 |
| Tuesday, January 1, 2019 | 8552000000 | 27685845000 |
| Wednesday, January 1, 2020 | 8828000000 | 34683731000 |
| Friday, January 1, 2021 | 10996000000 | 40635225000 |
| Saturday, January 1, 2022 | 12709000000 | 43729683000 |
| Sunday, January 1, 2023 | 13096000000 | 40404765000 |
Unleashing the power of data
In the ever-evolving landscape of global business, understanding cost structures is crucial. This analysis delves into the cost of revenue trends for two industry titans: Infosys Limited and NetEase, Inc., from 2014 to 2023.
Infosys, a leader in IT services, has seen its cost of revenue grow steadily, increasing by approximately 144% over the decade. Starting at around $5.4 billion in 2014, it reached nearly $13.1 billion by 2023. This growth reflects Infosys's expanding operations and strategic investments in technology.
Meanwhile, NetEase, a major player in the internet and gaming sector, experienced a staggering 1,140% increase in its cost of revenue, from $3.3 billion in 2014 to over $40.4 billion in 2023. This surge underscores the company's aggressive expansion and diversification strategies.
These trends highlight the dynamic nature of cost management in different sectors, offering valuable insights for investors and industry analysts alike.
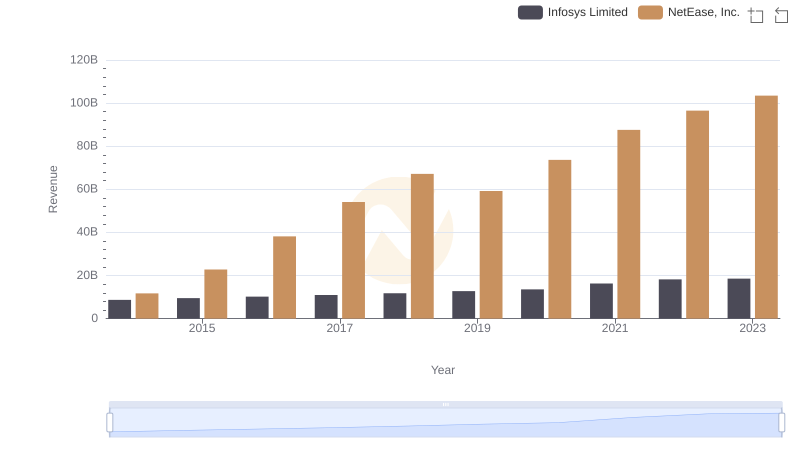
Infosys Limited vs NetEase, Inc.: Examining Key Revenue Metrics
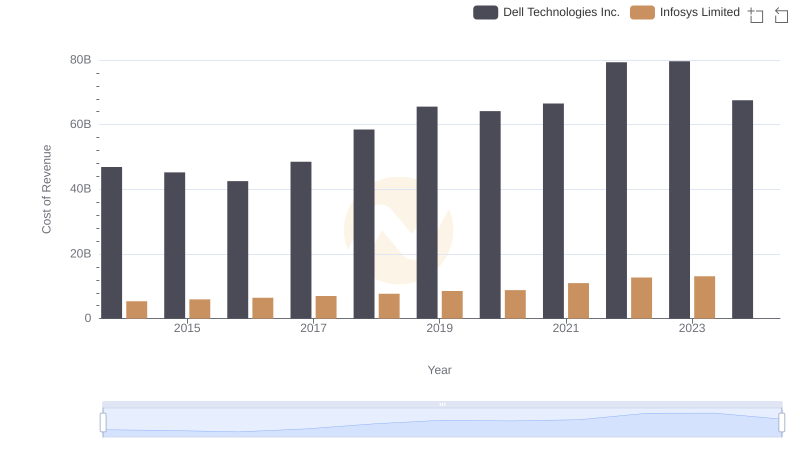
Cost Insights: Breaking Down Infosys Limited and Dell Technologies Inc.'s Expenses
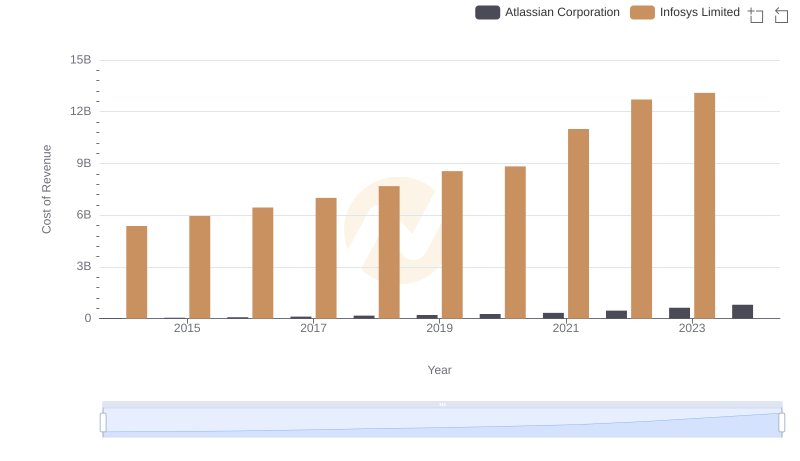
Analyzing Cost of Revenue: Infosys Limited and Atlassian Corporation
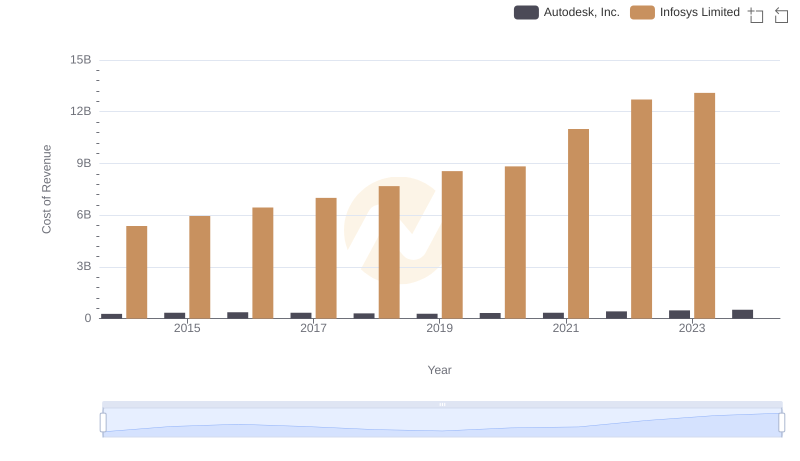
Analyzing Cost of Revenue: Infosys Limited and Autodesk, Inc.
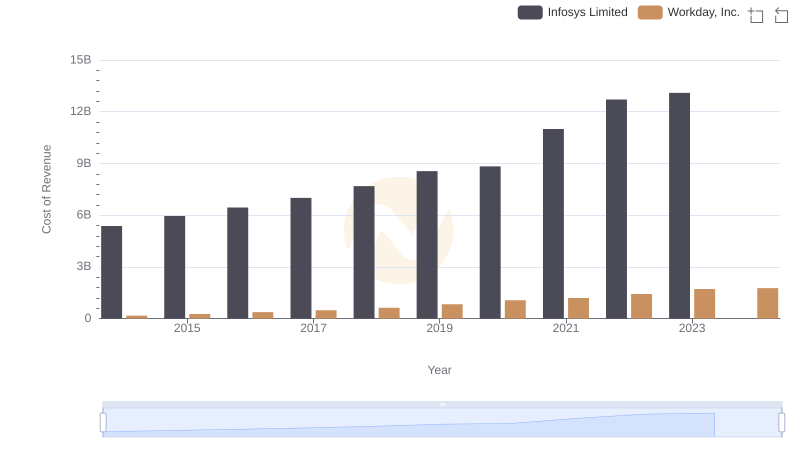
Cost of Revenue Trends: Infosys Limited vs Workday, Inc.
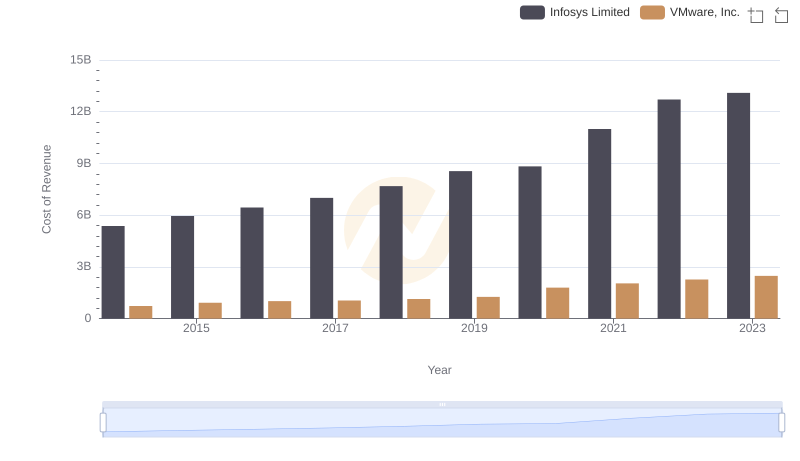
Cost Insights: Breaking Down Infosys Limited and VMware, Inc.'s Expenses
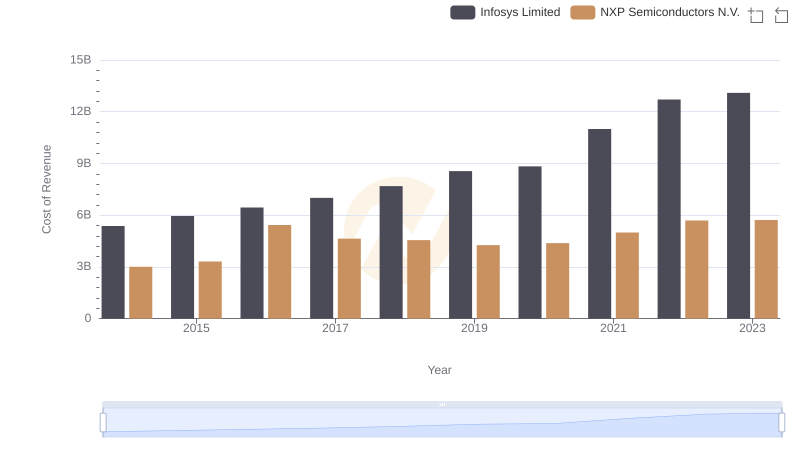
Analyzing Cost of Revenue: Infosys Limited and NXP Semiconductors N.V.
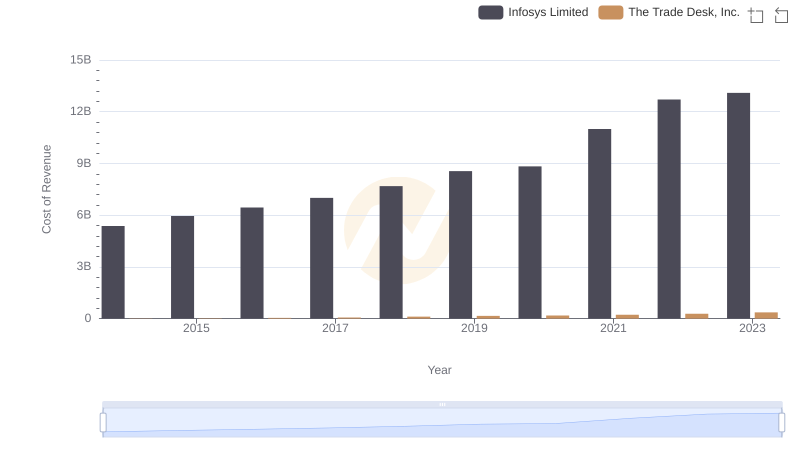
Cost of Revenue: Key Insights for Infosys Limited and The Trade Desk, Inc.
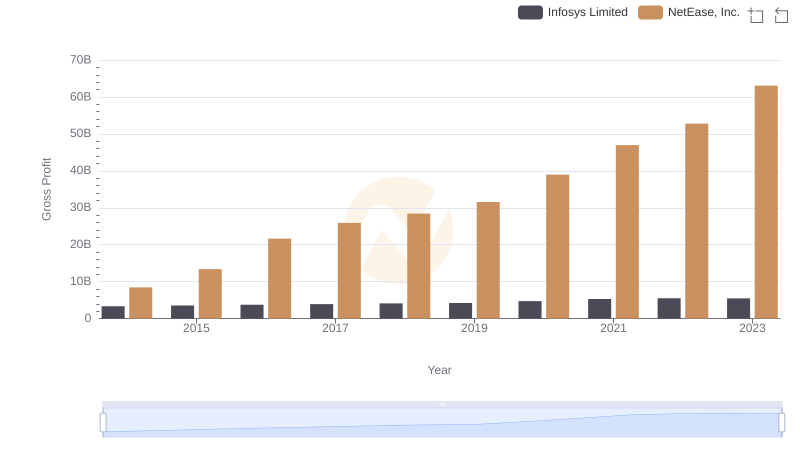
Gross Profit Comparison: Infosys Limited and NetEase, Inc. Trends
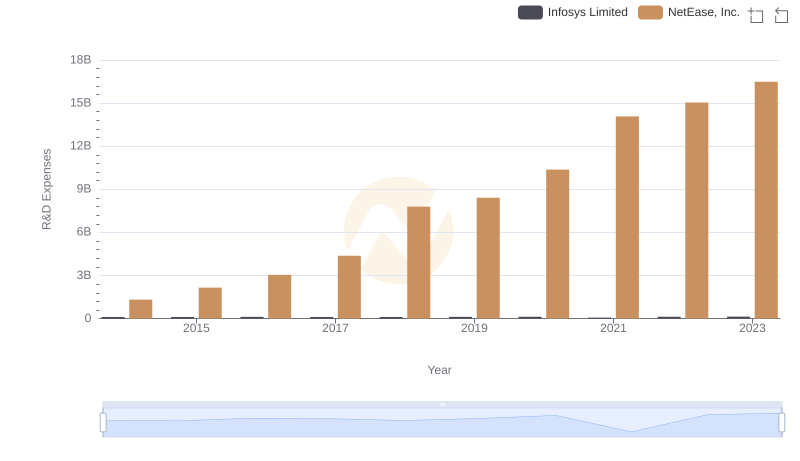
Infosys Limited or NetEase, Inc.: Who Invests More in Innovation?
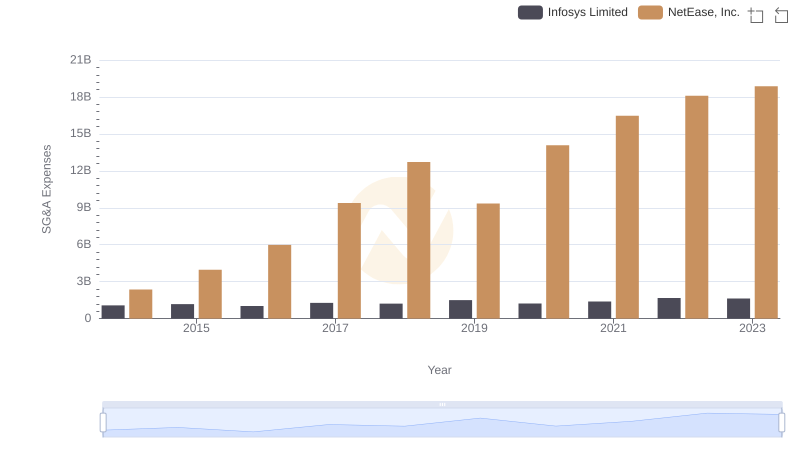
Cost Management Insights: SG&A Expenses for Infosys Limited and NetEase, Inc.
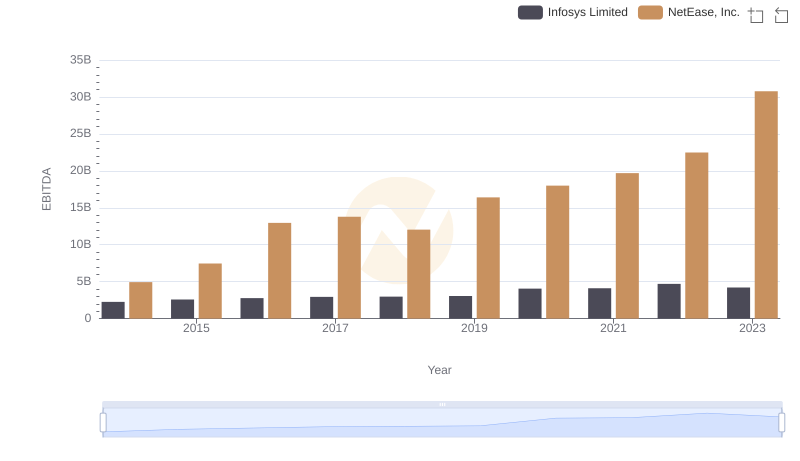
A Side-by-Side Analysis of EBITDA: Infosys Limited and NetEase, Inc.