| __timestamp | Infosys Limited | NetEase, Inc. |
|---|---|---|
| Wednesday, January 1, 2014 | 2258000000 | 4939587000 |
| Thursday, January 1, 2015 | 2590000000 | 7454573000 |
| Friday, January 1, 2016 | 2765000000 | 12956379000 |
| Sunday, January 1, 2017 | 2936000000 | 13786691000 |
| Monday, January 1, 2018 | 2984000000 | 12037479000 |
| Tuesday, January 1, 2019 | 3053000000 | 16404433000 |
| Wednesday, January 1, 2020 | 4053342784 | 17996187000 |
| Friday, January 1, 2021 | 4116000000 | 19692797000 |
| Saturday, January 1, 2022 | 4707334610 | 22486802000 |
| Sunday, January 1, 2023 | 4206000000 | 30764404000 |
Cracking the code
In the ever-evolving landscape of global business, understanding the financial health of companies is crucial. This analysis delves into the EBITDA performance of two industry giants: Infosys Limited, a leader in IT services, and NetEase, Inc., a prominent player in the internet technology sector. From 2014 to 2023, NetEase, Inc. has consistently outperformed Infosys Limited in terms of EBITDA, showcasing a remarkable growth trajectory. In 2014, NetEase's EBITDA was approximately 119% higher than that of Infosys. By 2023, this gap widened significantly, with NetEase's EBITDA being over 630% higher. This stark contrast highlights NetEase's aggressive expansion and strategic investments in the digital space. Meanwhile, Infosys has shown steady growth, with its EBITDA increasing by about 86% over the same period. This comparison underscores the dynamic nature of global markets and the diverse strategies companies employ to thrive.
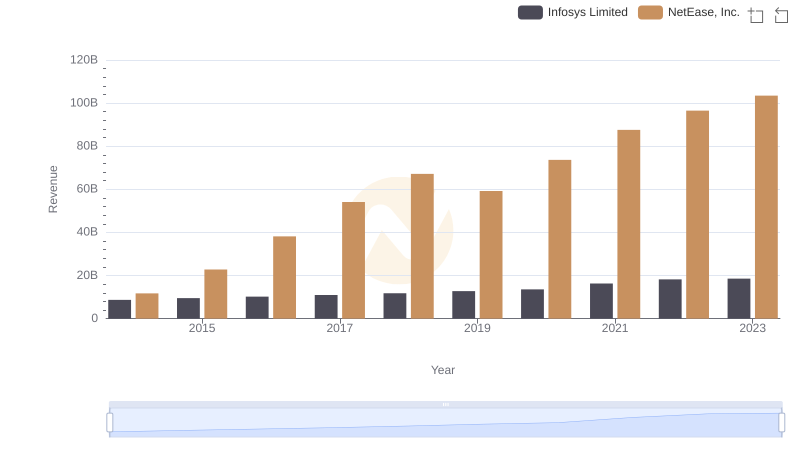
Infosys Limited vs NetEase, Inc.: Examining Key Revenue Metrics
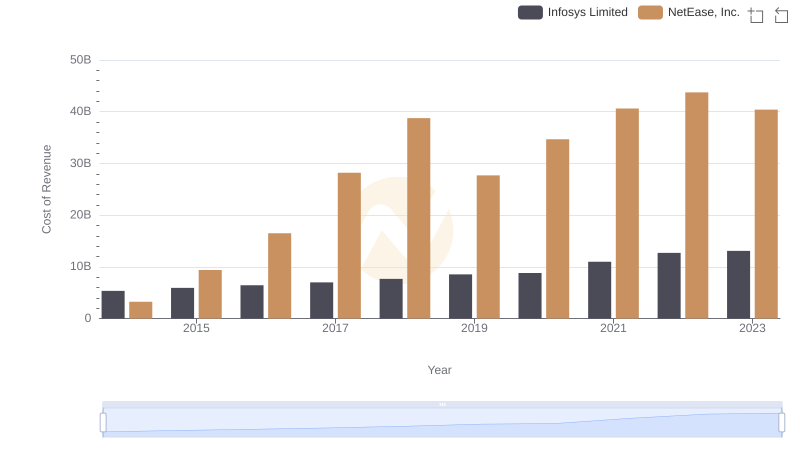
Cost of Revenue Trends: Infosys Limited vs NetEase, Inc.
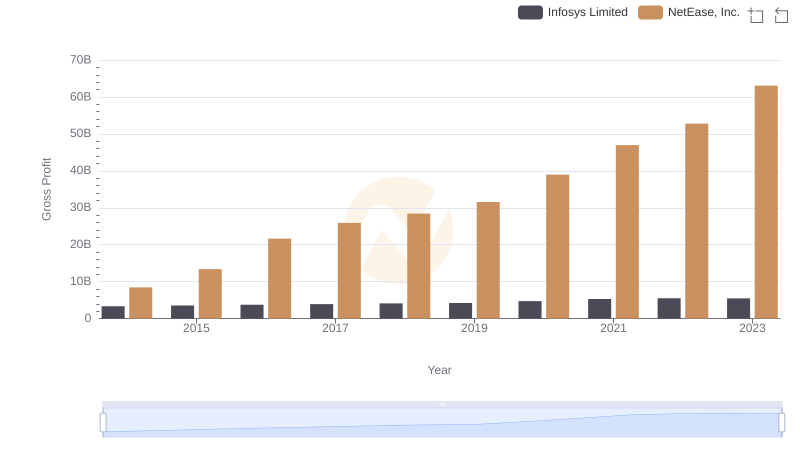
Gross Profit Comparison: Infosys Limited and NetEase, Inc. Trends
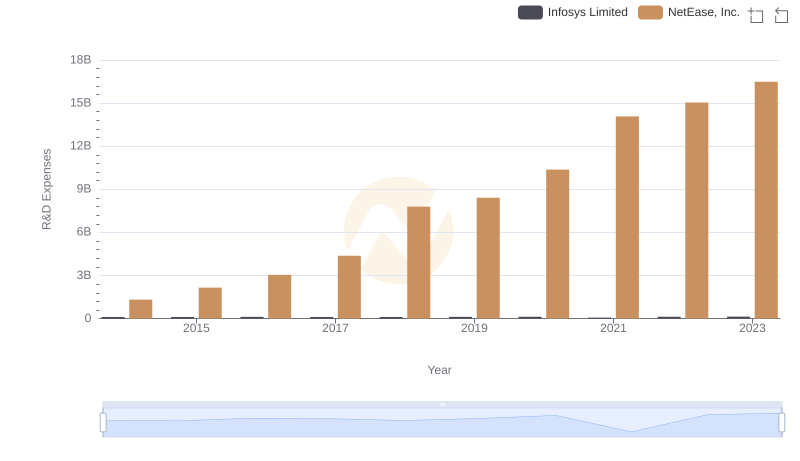
Infosys Limited or NetEase, Inc.: Who Invests More in Innovation?
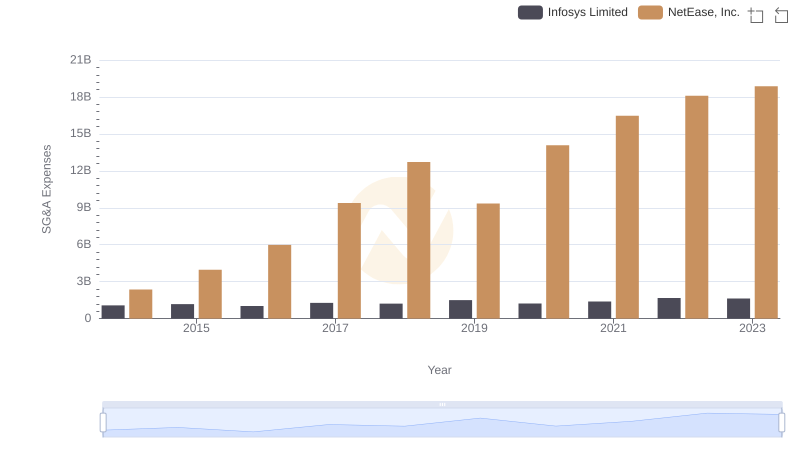
Cost Management Insights: SG&A Expenses for Infosys Limited and NetEase, Inc.
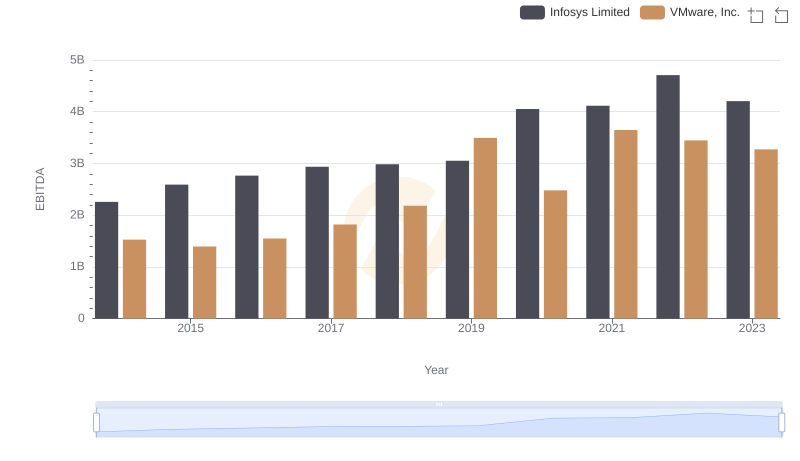
Comprehensive EBITDA Comparison: Infosys Limited vs VMware, Inc.
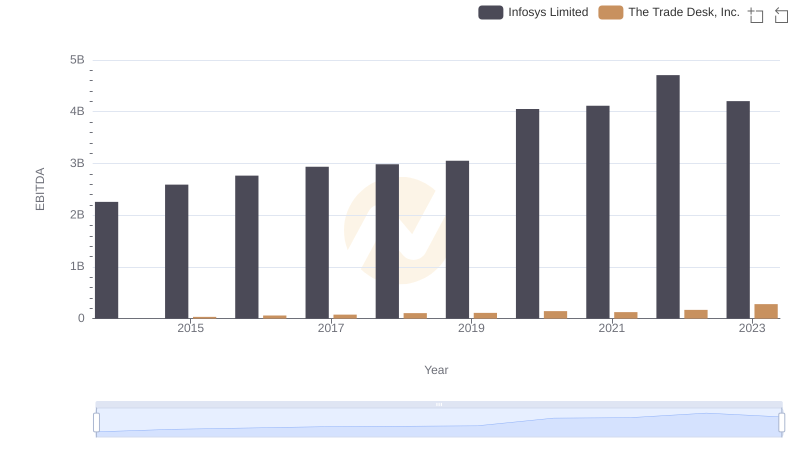
Infosys Limited and The Trade Desk, Inc.: A Detailed Examination of EBITDA Performance
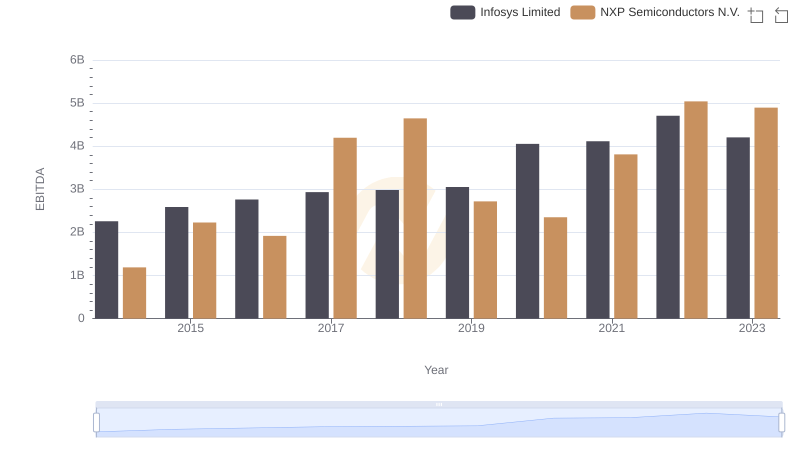
EBITDA Metrics Evaluated: Infosys Limited vs NXP Semiconductors N.V.
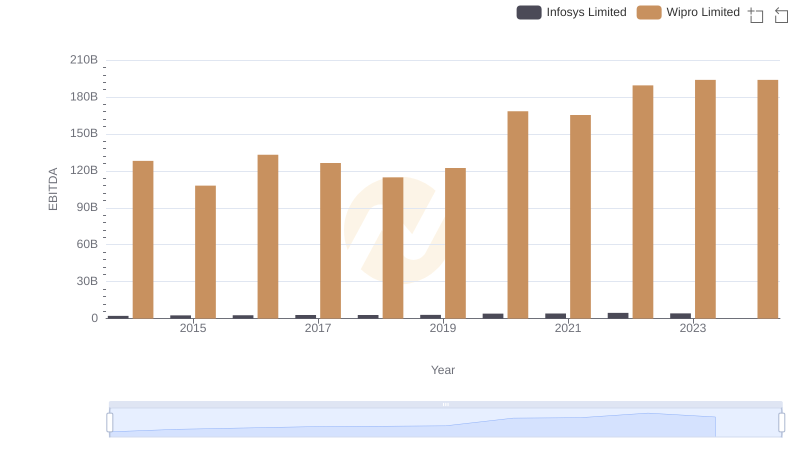
Comparative EBITDA Analysis: Infosys Limited vs Wipro Limited
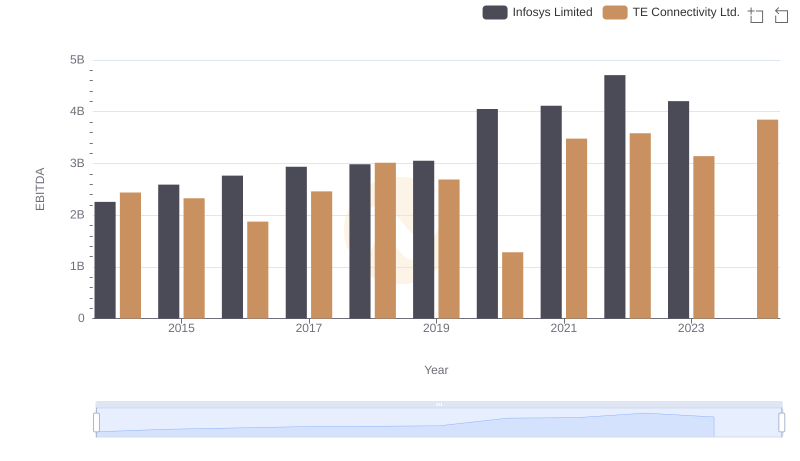
Professional EBITDA Benchmarking: Infosys Limited vs TE Connectivity Ltd.
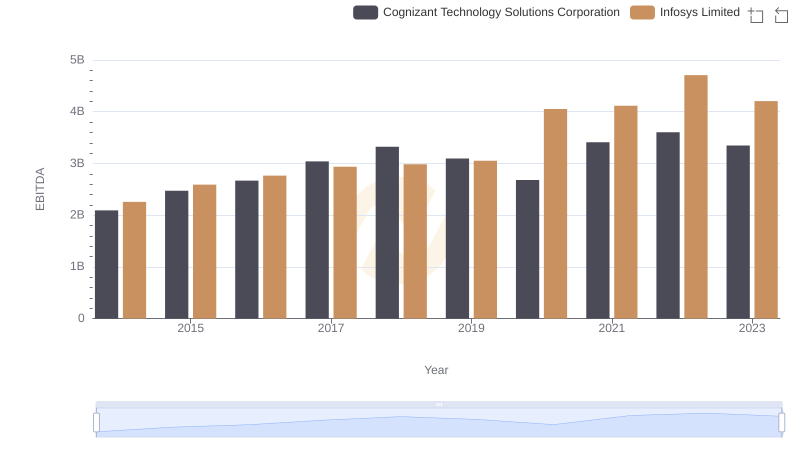
Professional EBITDA Benchmarking: Infosys Limited vs Cognizant Technology Solutions Corporation
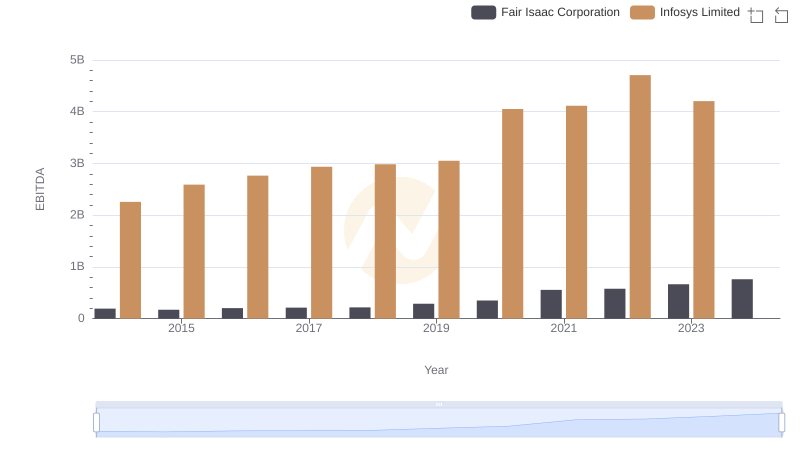
A Side-by-Side Analysis of EBITDA: Infosys Limited and Fair Isaac Corporation