| __timestamp | Infosys Limited | NXP Semiconductors N.V. |
|---|---|---|
| Wednesday, January 1, 2014 | 3337000000 | 2640000000 |
| Thursday, January 1, 2015 | 3551000000 | 2787000000 |
| Friday, January 1, 2016 | 3762000000 | 4069000000 |
| Sunday, January 1, 2017 | 3938000000 | 4619000000 |
| Monday, January 1, 2018 | 4112000000 | 4851000000 |
| Tuesday, January 1, 2019 | 4228000000 | 4618000000 |
| Wednesday, January 1, 2020 | 4733000000 | 4235000000 |
| Friday, January 1, 2021 | 5315000000 | 6067000000 |
| Saturday, January 1, 2022 | 5503000000 | 7517000000 |
| Sunday, January 1, 2023 | 5466000000 | 7553000000 |
Unveiling the hidden dimensions of data
In the ever-evolving landscape of global technology, the financial performance of industry giants like Infosys Limited and NXP Semiconductors N.V. offers a fascinating glimpse into their strategic prowess. Over the past decade, from 2014 to 2023, both companies have demonstrated remarkable growth in gross profit, albeit with distinct trajectories.
Infosys, a leader in IT services, has seen its gross profit rise by approximately 64%, from $3.3 billion in 2014 to $5.5 billion in 2023. This steady growth reflects its robust business model and expanding global footprint. Meanwhile, NXP Semiconductors, a key player in the semiconductor industry, has experienced an even more impressive surge of 186%, from $2.6 billion to $7.6 billion over the same period. This dramatic increase underscores the booming demand for semiconductors in the digital age.
These trends highlight the dynamic nature of the tech industry, where innovation and strategic investments drive financial success.
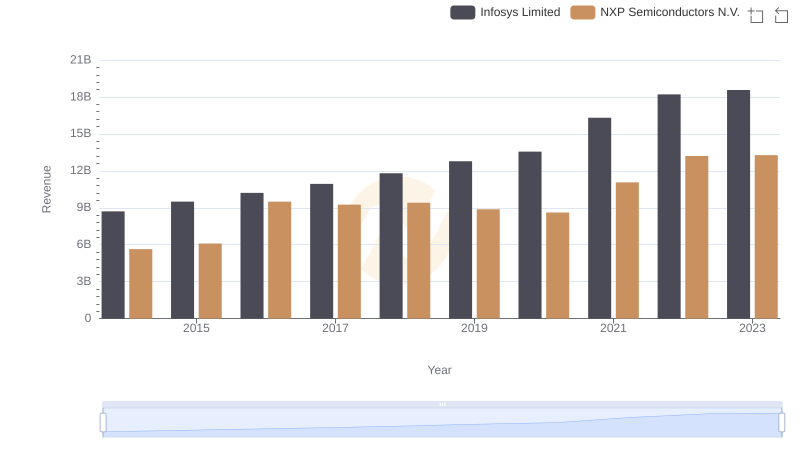
Revenue Insights: Infosys Limited and NXP Semiconductors N.V. Performance Compared
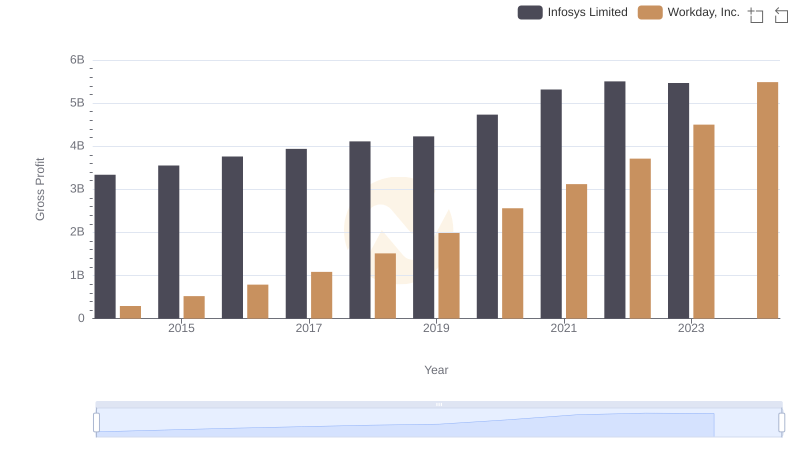
Key Insights on Gross Profit: Infosys Limited vs Workday, Inc.
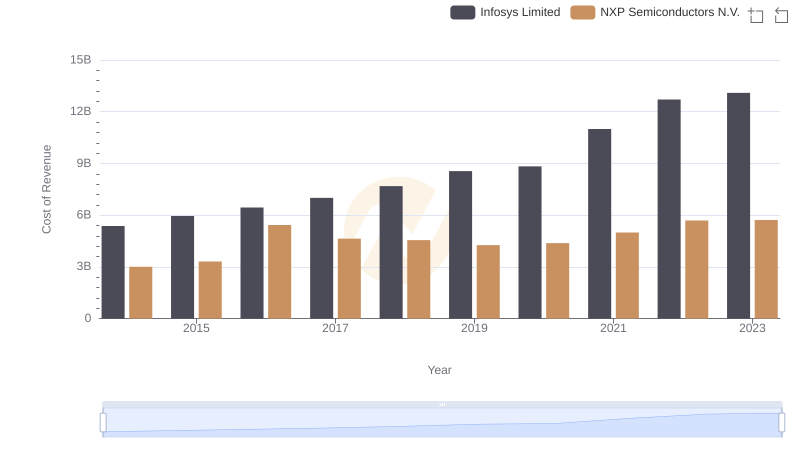
Analyzing Cost of Revenue: Infosys Limited and NXP Semiconductors N.V.
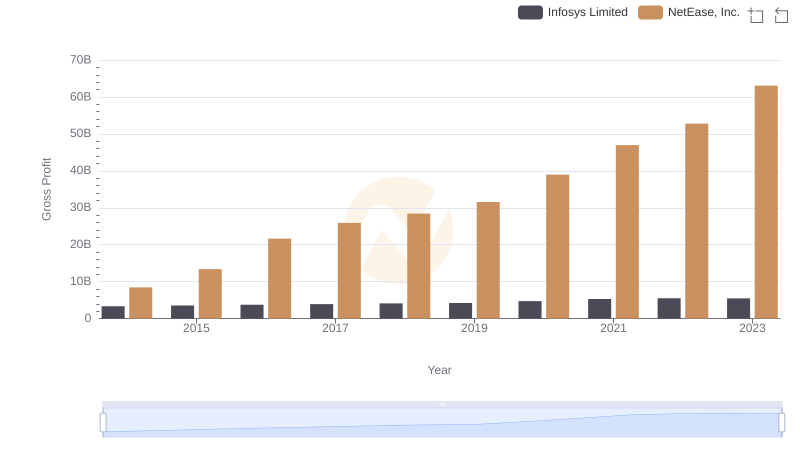
Gross Profit Comparison: Infosys Limited and NetEase, Inc. Trends
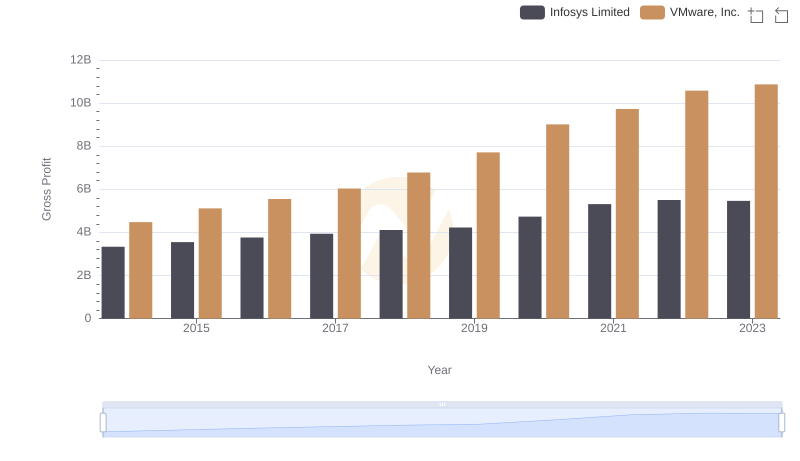
Gross Profit Trends Compared: Infosys Limited vs VMware, Inc.
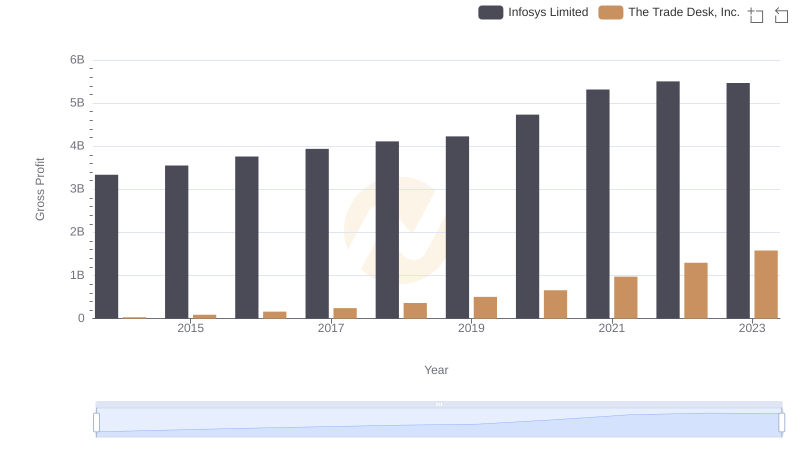
Key Insights on Gross Profit: Infosys Limited vs The Trade Desk, Inc.
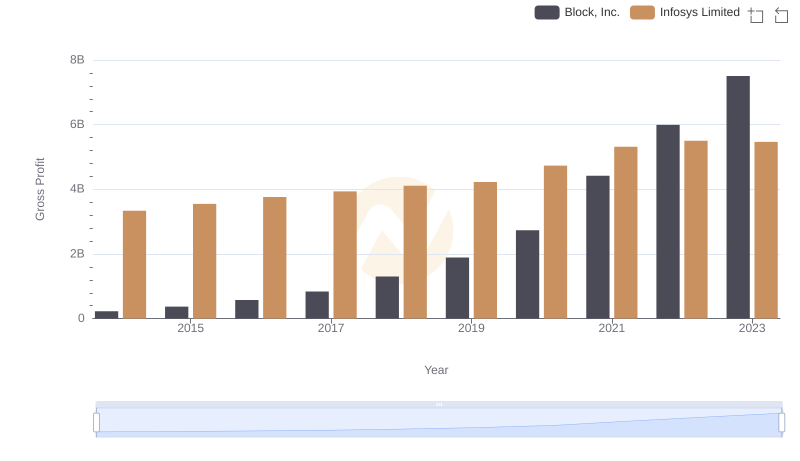
Gross Profit Comparison: Infosys Limited and Block, Inc. Trends
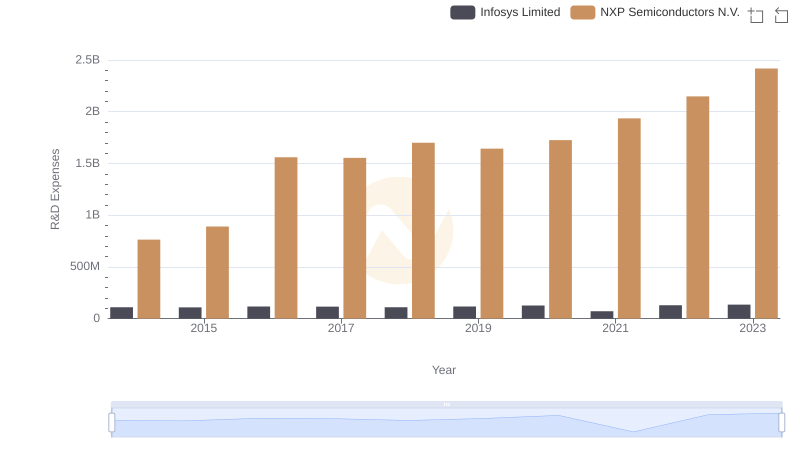
Research and Development Investment: Infosys Limited vs NXP Semiconductors N.V.
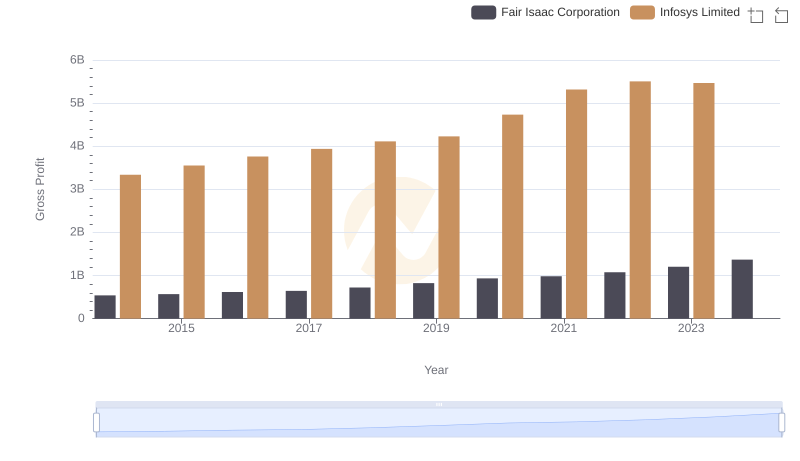
Gross Profit Trends Compared: Infosys Limited vs Fair Isaac Corporation
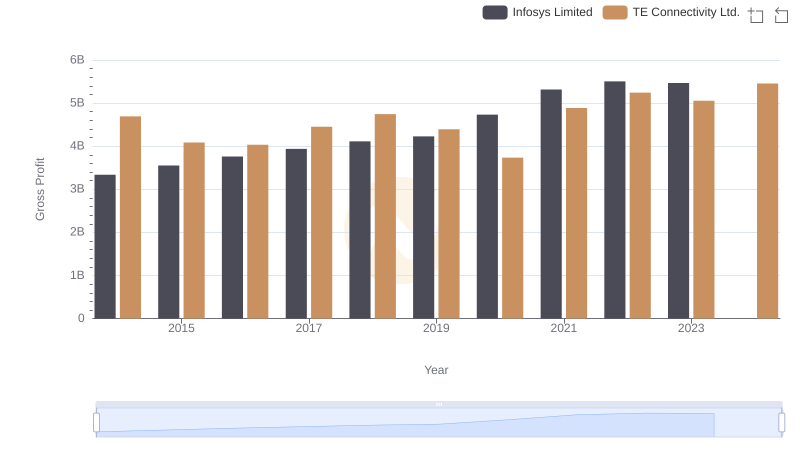
Who Generates Higher Gross Profit? Infosys Limited or TE Connectivity Ltd.
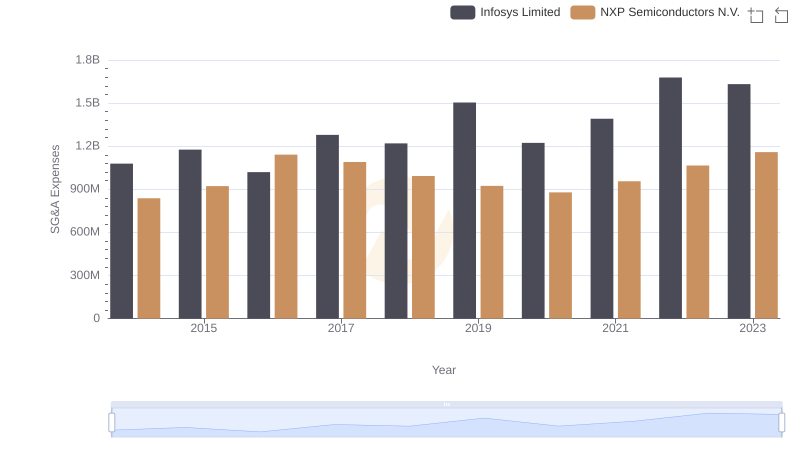
SG&A Efficiency Analysis: Comparing Infosys Limited and NXP Semiconductors N.V.
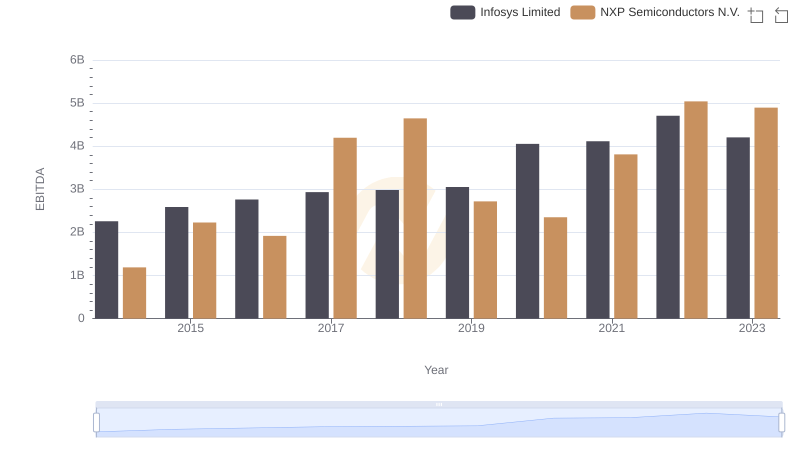
EBITDA Metrics Evaluated: Infosys Limited vs NXP Semiconductors N.V.