| __timestamp | Dell Technologies Inc. | Infosys Limited |
|---|---|---|
| Wednesday, January 1, 2014 | 9485000000 | 3337000000 |
| Thursday, January 1, 2015 | 8896000000 | 3551000000 |
| Friday, January 1, 2016 | 8387000000 | 3762000000 |
| Sunday, January 1, 2017 | 13649000000 | 3938000000 |
| Monday, January 1, 2018 | 20537000000 | 4112000000 |
| Tuesday, January 1, 2019 | 25053000000 | 4228000000 |
| Wednesday, January 1, 2020 | 20639000000 | 4733000000 |
| Friday, January 1, 2021 | 20140000000 | 5315000000 |
| Saturday, January 1, 2022 | 21891000000 | 5503000000 |
| Sunday, January 1, 2023 | 22686000000 | 5466000000 |
| Monday, January 1, 2024 | 20869000000 |
Unleashing insights
In the ever-evolving landscape of global technology, the financial performance of industry giants like Infosys Limited and Dell Technologies Inc. offers a fascinating glimpse into their strategic prowess. Over the past decade, Dell Technologies has demonstrated a robust growth trajectory, with its gross profit surging by approximately 140% from 2014 to 2023. This impressive growth underscores Dell's ability to adapt and thrive in a competitive market.
Conversely, Infosys Limited, a leader in IT services, has shown steady growth, with its gross profit increasing by around 64% over the same period. This consistent performance highlights Infosys's resilience and strategic focus on innovation and customer-centric solutions.
While Dell's financial data for 2024 is available, Infosys's figures remain undisclosed, leaving room for speculation about its future performance. As these two titans continue to navigate the complexities of the tech industry, their financial trajectories will undoubtedly remain a focal point for investors and analysts alike.
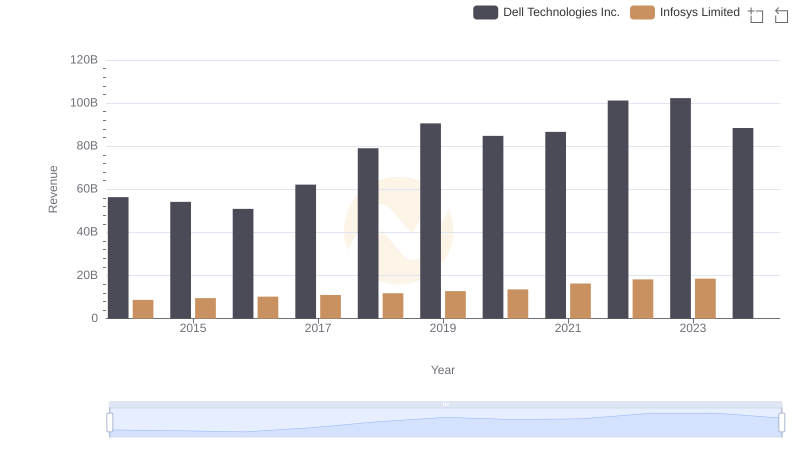
Annual Revenue Comparison: Infosys Limited vs Dell Technologies Inc.
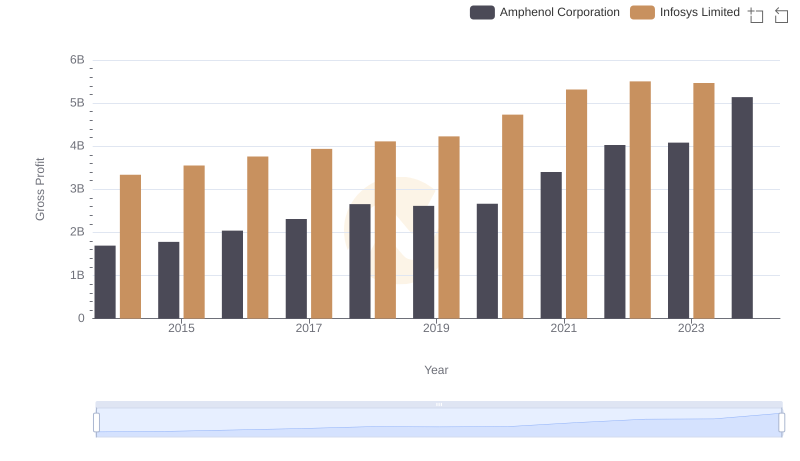
Infosys Limited vs Amphenol Corporation: A Gross Profit Performance Breakdown
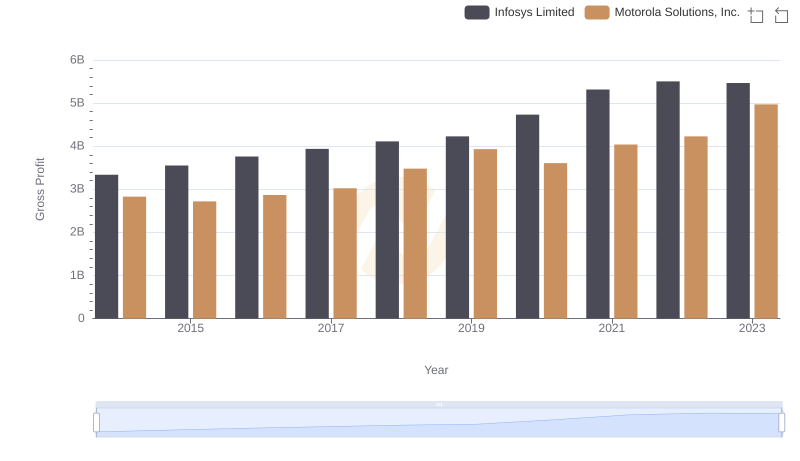
Who Generates Higher Gross Profit? Infosys Limited or Motorola Solutions, Inc.
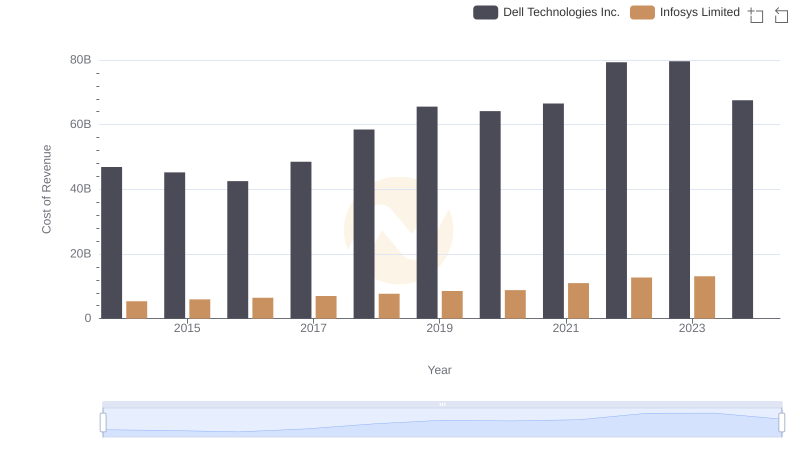
Cost Insights: Breaking Down Infosys Limited and Dell Technologies Inc.'s Expenses
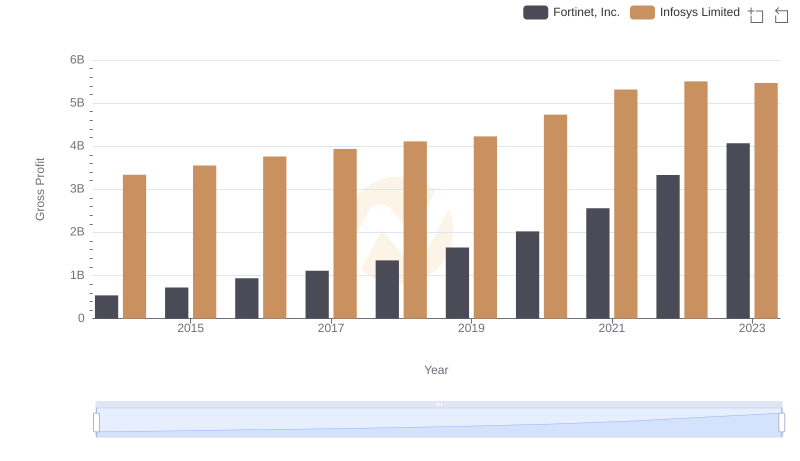
Infosys Limited vs Fortinet, Inc.: A Gross Profit Performance Breakdown
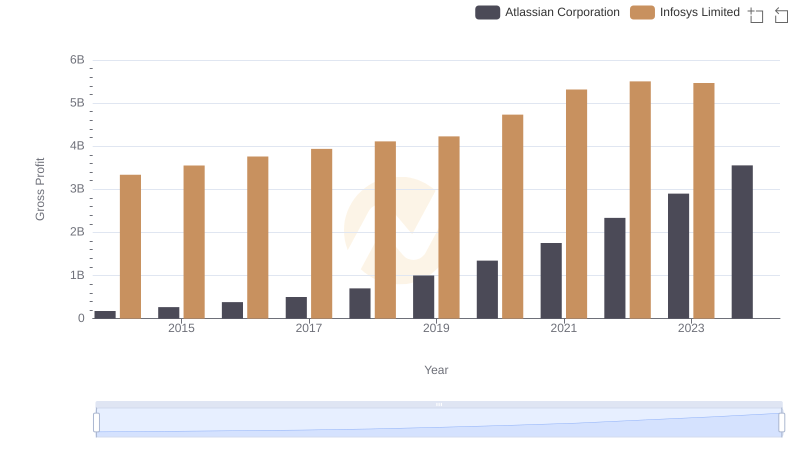
Gross Profit Comparison: Infosys Limited and Atlassian Corporation Trends
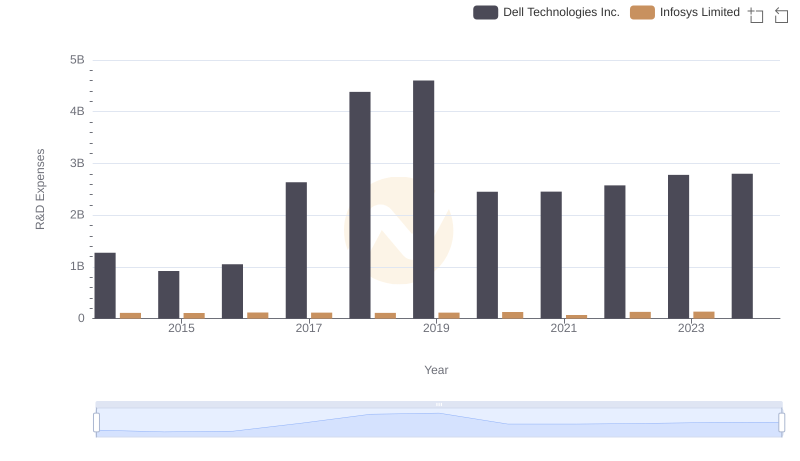
Research and Development Investment: Infosys Limited vs Dell Technologies Inc.
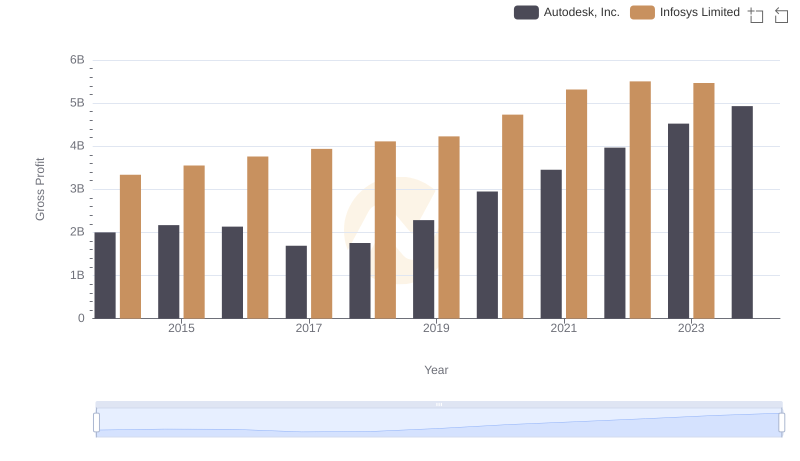
Gross Profit Comparison: Infosys Limited and Autodesk, Inc. Trends
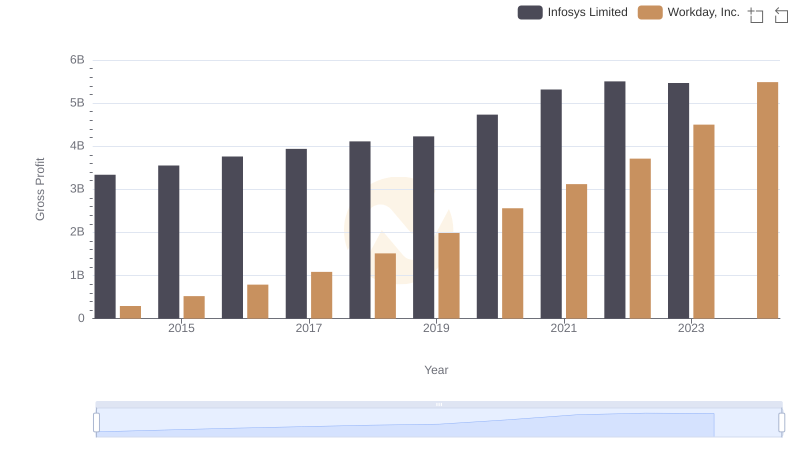
Key Insights on Gross Profit: Infosys Limited vs Workday, Inc.
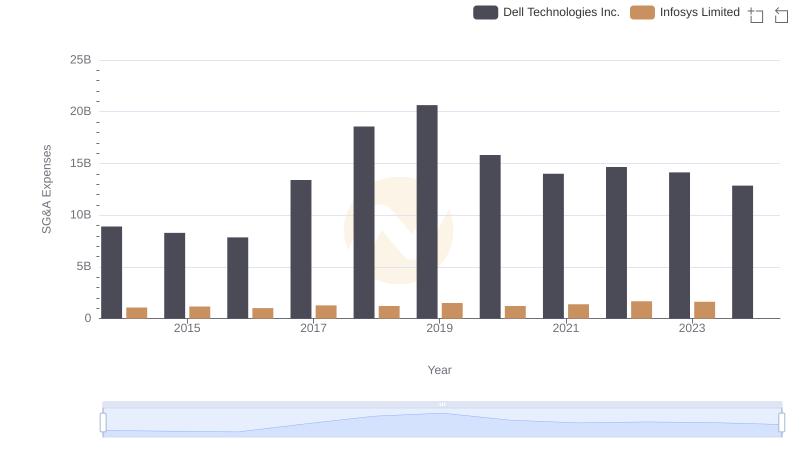
Infosys Limited or Dell Technologies Inc.: Who Manages SG&A Costs Better?
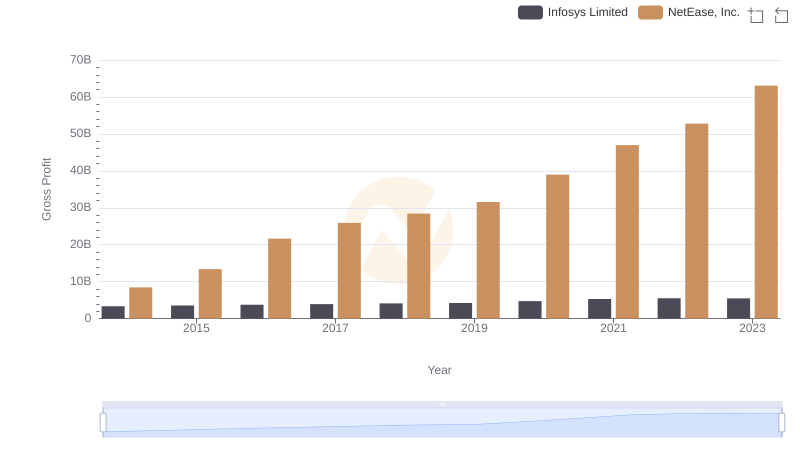
Gross Profit Comparison: Infosys Limited and NetEase, Inc. Trends
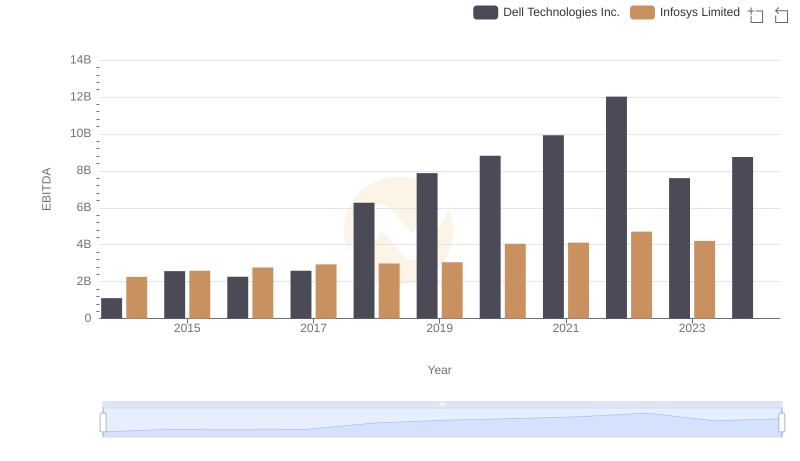
EBITDA Metrics Evaluated: Infosys Limited vs Dell Technologies Inc.