| __timestamp | Comfort Systems USA, Inc. | Global Payments Inc. |
|---|---|---|
| Wednesday, January 1, 2014 | 249771000 | 1751611000 |
| Thursday, January 1, 2015 | 318129000 | 1750511000 |
| Friday, January 1, 2016 | 344009000 | 1767444000 |
| Sunday, January 1, 2017 | 366281000 | 2047126000 |
| Monday, January 1, 2018 | 446279000 | 2271352000 |
| Tuesday, January 1, 2019 | 501943000 | 2838089000 |
| Wednesday, January 1, 2020 | 546983000 | 3772831000 |
| Friday, January 1, 2021 | 563207000 | 4750037000 |
| Saturday, January 1, 2022 | 741608000 | 5196898000 |
| Sunday, January 1, 2023 | 990509000 | 5926898000 |
| Monday, January 1, 2024 | 6345778000 |
Unveiling the hidden dimensions of data
In the competitive landscape of the U.S. stock market, understanding which companies generate higher gross profits can offer valuable insights for investors. Over the past decade, Global Payments Inc. has consistently outperformed Comfort Systems USA, Inc. in terms of gross profit. From 2014 to 2023, Global Payments Inc. saw its gross profit soar by approximately 238%, reaching nearly $5.93 billion in 2023. In contrast, Comfort Systems USA, Inc. experienced a more modest growth of around 297%, culminating in a gross profit of about $990 million in the same year.
This stark difference highlights the varying scales and market strategies of these two companies. While Comfort Systems USA, Inc. has shown steady growth, Global Payments Inc. has leveraged its position in the financial technology sector to achieve substantial gains. Investors should consider these trends when evaluating potential opportunities in these industries.
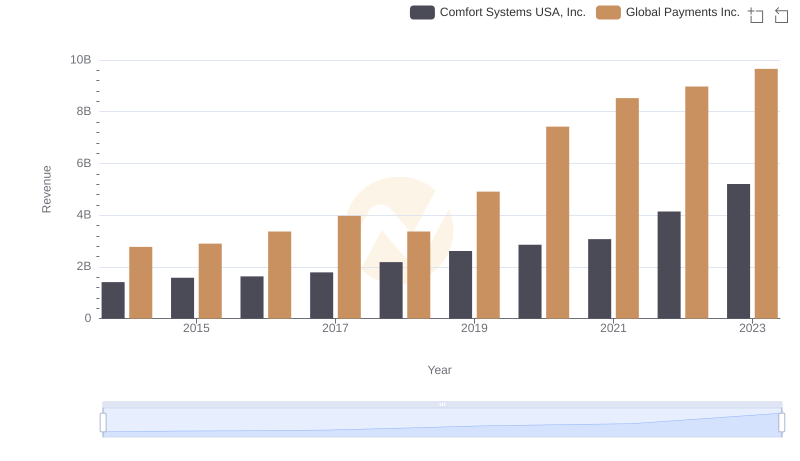
Revenue Insights: Global Payments Inc. and Comfort Systems USA, Inc. Performance Compared
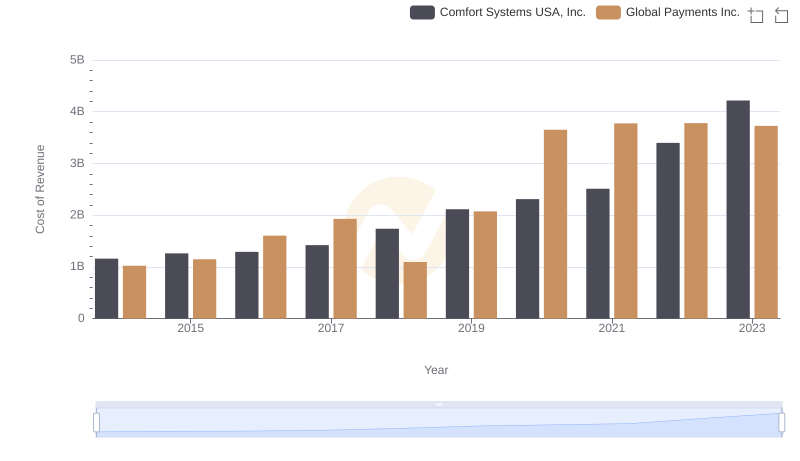
Comparing Cost of Revenue Efficiency: Global Payments Inc. vs Comfort Systems USA, Inc.
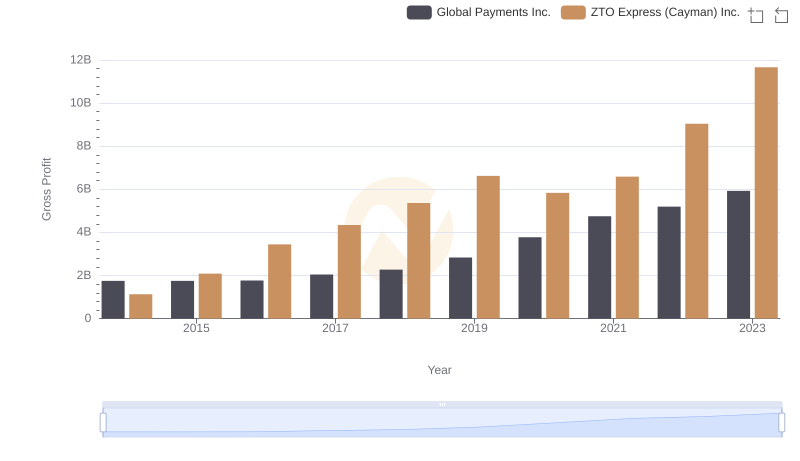
Global Payments Inc. vs ZTO Express (Cayman) Inc.: A Gross Profit Performance Breakdown
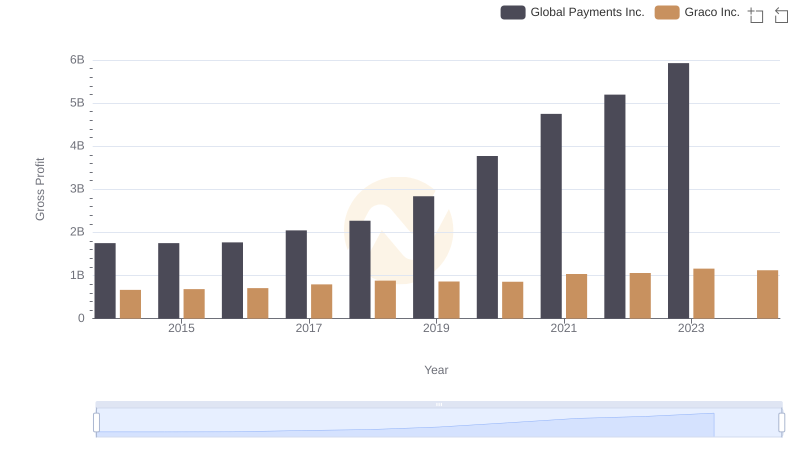
Gross Profit Comparison: Global Payments Inc. and Graco Inc. Trends
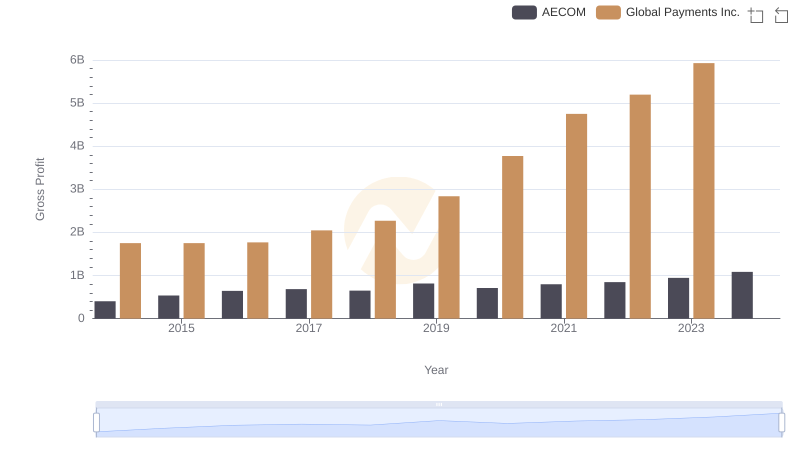
Global Payments Inc. and AECOM: A Detailed Gross Profit Analysis
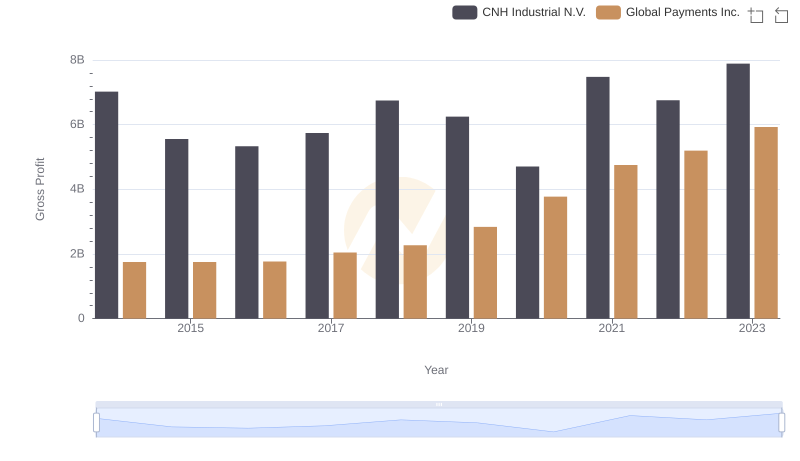
Key Insights on Gross Profit: Global Payments Inc. vs CNH Industrial N.V.
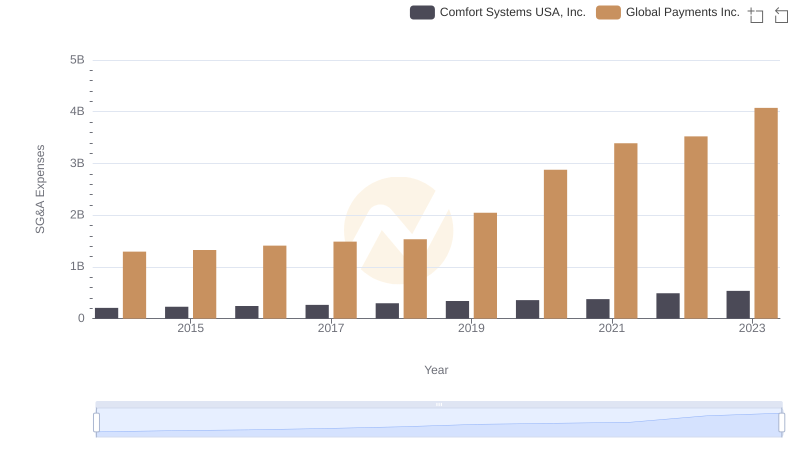
Selling, General, and Administrative Costs: Global Payments Inc. vs Comfort Systems USA, Inc.

Key Insights on Gross Profit: Global Payments Inc. vs Pool Corporation
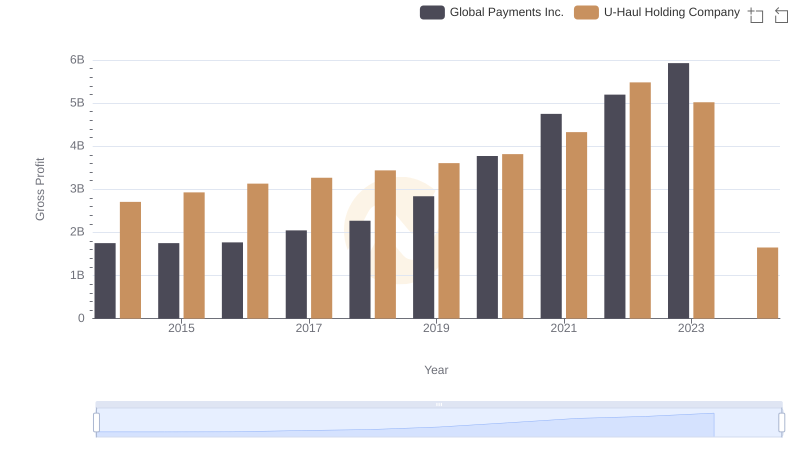
Gross Profit Comparison: Global Payments Inc. and U-Haul Holding Company Trends
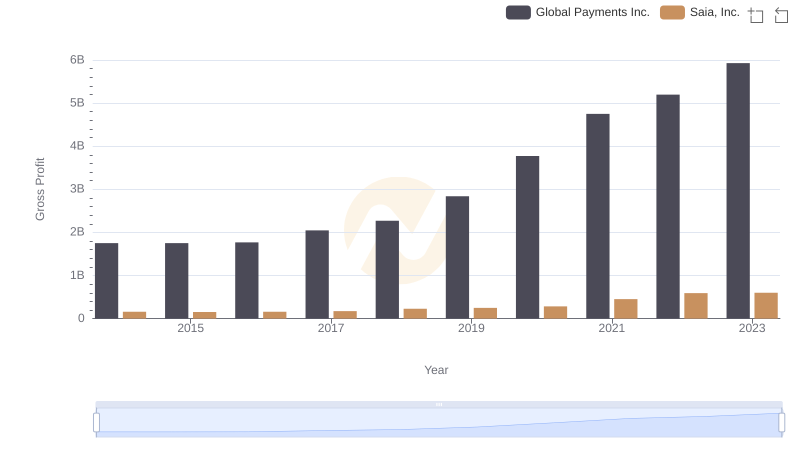
Who Generates Higher Gross Profit? Global Payments Inc. or Saia, Inc.
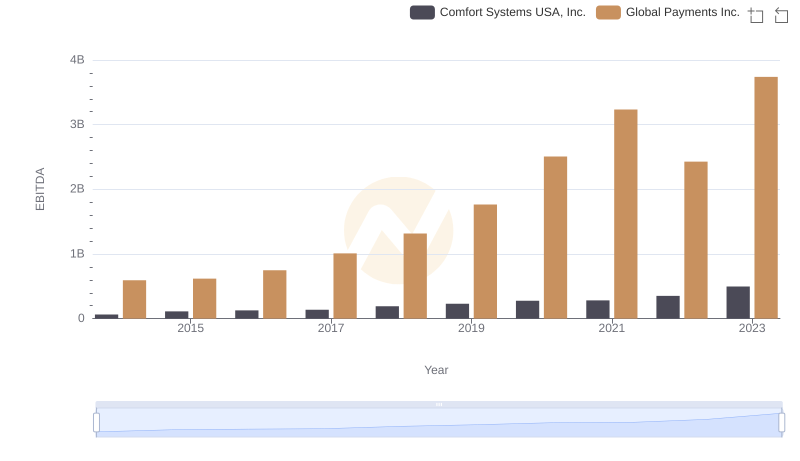
A Side-by-Side Analysis of EBITDA: Global Payments Inc. and Comfort Systems USA, Inc.