| __timestamp | Avery Dennison Corporation | Global Payments Inc. |
|---|---|---|
| Wednesday, January 1, 2014 | 1651200000 | 1751611000 |
| Thursday, January 1, 2015 | 1645800000 | 1750511000 |
| Friday, January 1, 2016 | 1699700000 | 1767444000 |
| Sunday, January 1, 2017 | 1812200000 | 2047126000 |
| Monday, January 1, 2018 | 1915500000 | 2271352000 |
| Tuesday, January 1, 2019 | 1904100000 | 2838089000 |
| Wednesday, January 1, 2020 | 1923300000 | 3772831000 |
| Friday, January 1, 2021 | 2312800000 | 4750037000 |
| Saturday, January 1, 2022 | 2404200000 | 5196898000 |
| Sunday, January 1, 2023 | 2277499999 | 5926898000 |
| Monday, January 1, 2024 | 2530700000 | 6345778000 |
Igniting the spark of knowledge
In the ever-evolving landscape of global commerce, two industry titans, Global Payments Inc. and Avery Dennison Corporation, have showcased remarkable financial trajectories over the past decade. From 2014 to 2023, Global Payments Inc. has seen its gross profit soar by approximately 238%, reflecting its robust expansion and strategic acquisitions. In contrast, Avery Dennison Corporation, a leader in labeling and packaging materials, has experienced a steady growth of around 38% in the same period.
These trends not only reflect the companies' strategic prowess but also offer a glimpse into the broader economic shifts influencing their respective industries.
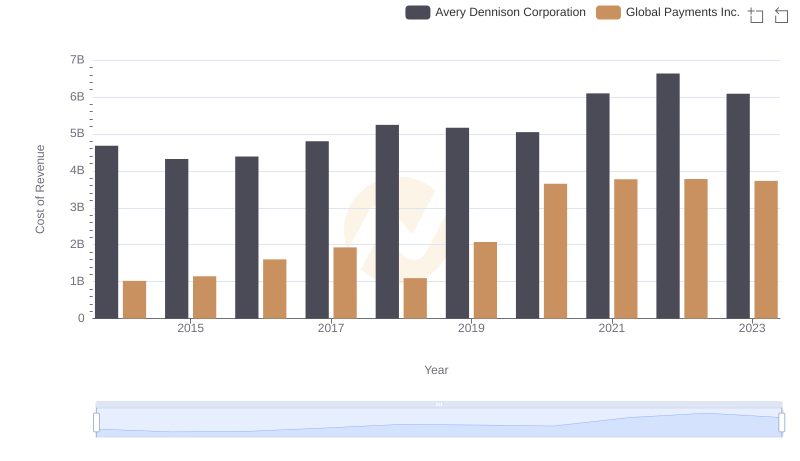
Cost of Revenue Comparison: Global Payments Inc. vs Avery Dennison Corporation
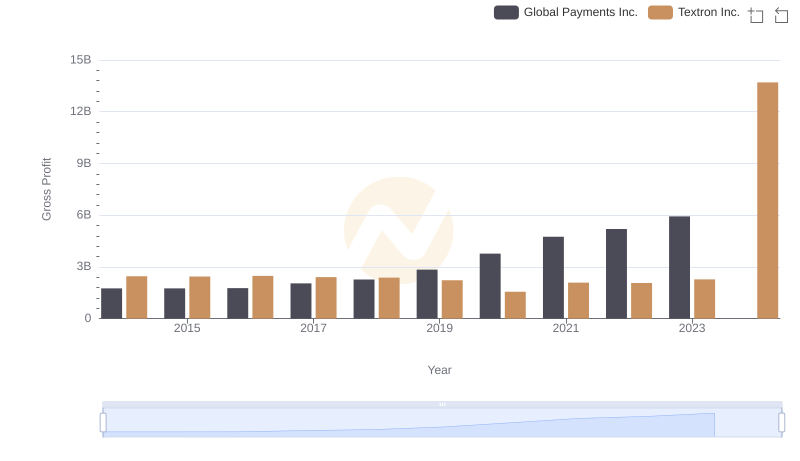
Key Insights on Gross Profit: Global Payments Inc. vs Textron Inc.
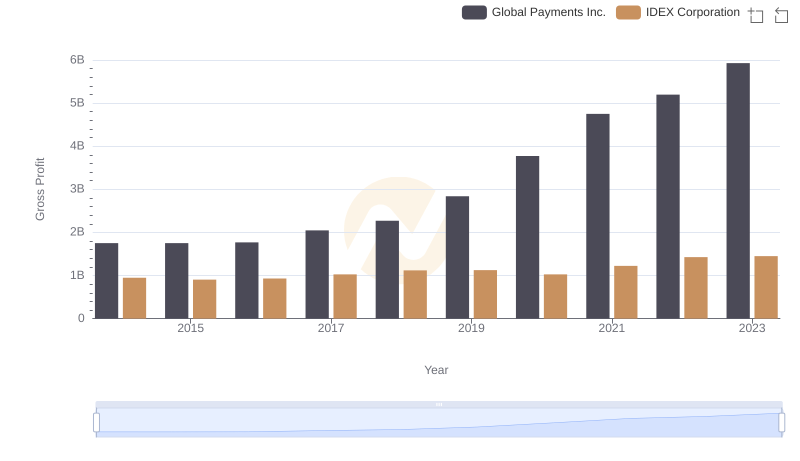
Gross Profit Comparison: Global Payments Inc. and IDEX Corporation Trends
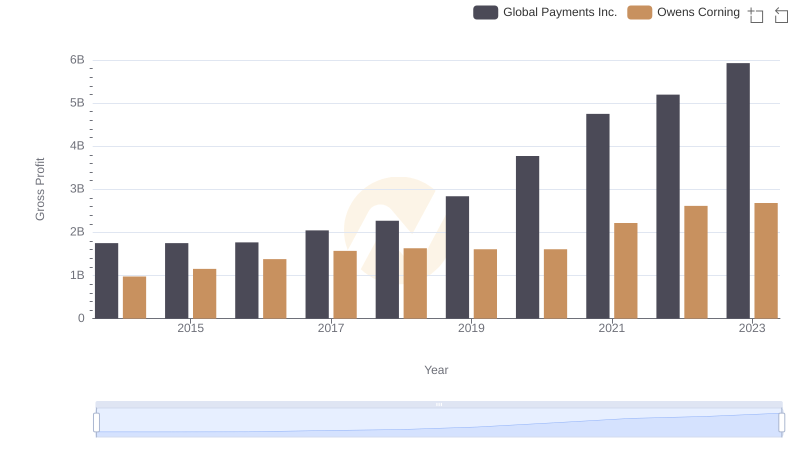
Global Payments Inc. and Owens Corning: A Detailed Gross Profit Analysis
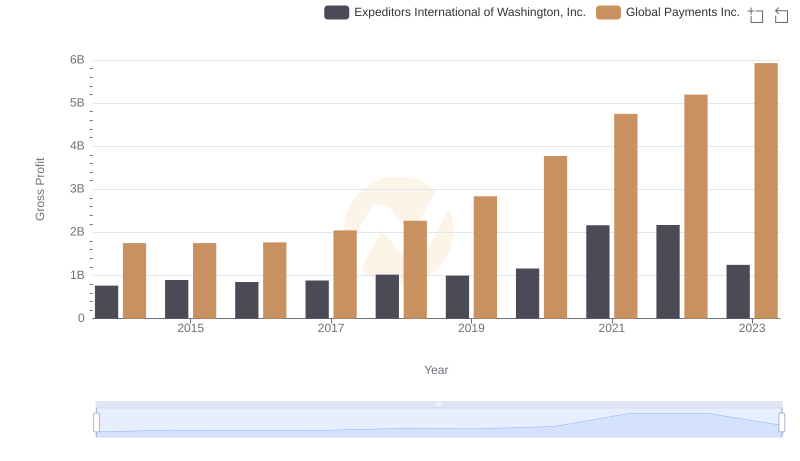
Gross Profit Trends Compared: Global Payments Inc. vs Expeditors International of Washington, Inc.
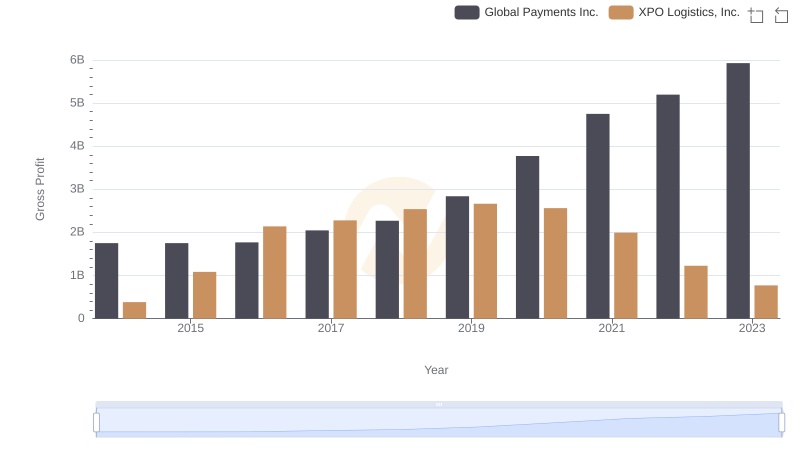
Gross Profit Analysis: Comparing Global Payments Inc. and XPO Logistics, Inc.
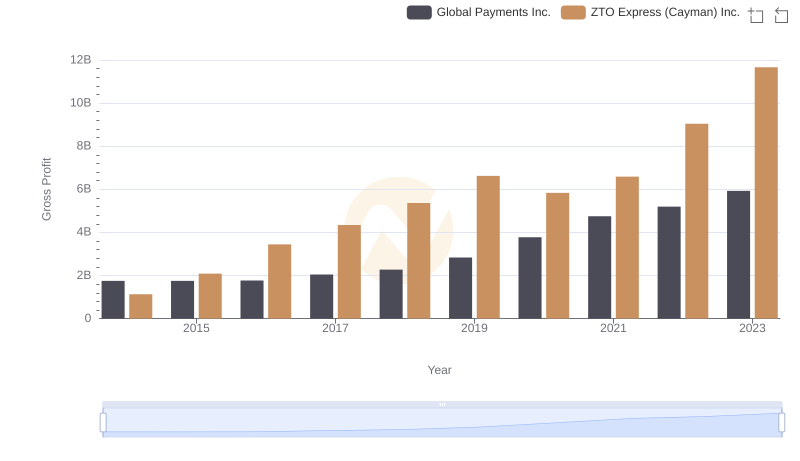
Global Payments Inc. vs ZTO Express (Cayman) Inc.: A Gross Profit Performance Breakdown
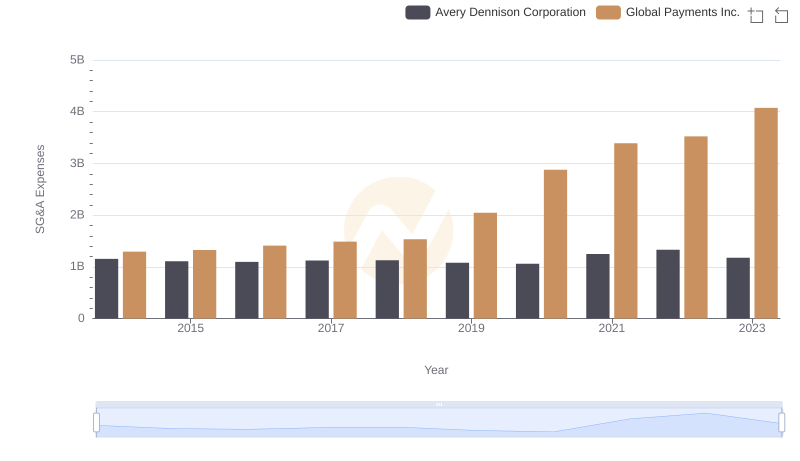
Comparing SG&A Expenses: Global Payments Inc. vs Avery Dennison Corporation Trends and Insights
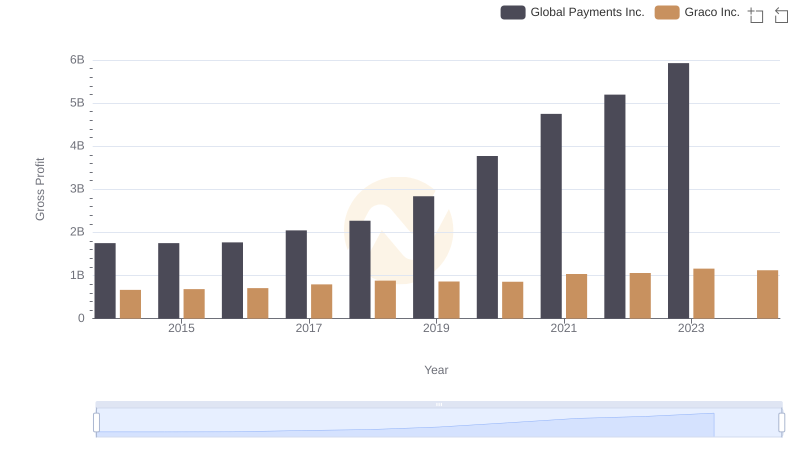
Gross Profit Comparison: Global Payments Inc. and Graco Inc. Trends
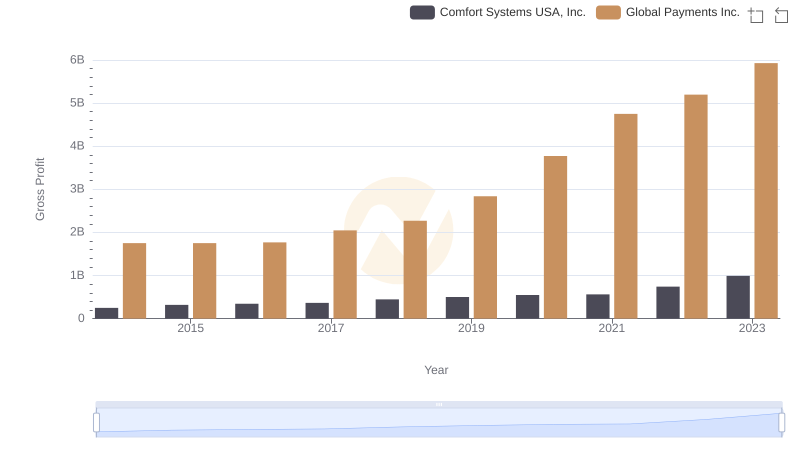
Who Generates Higher Gross Profit? Global Payments Inc. or Comfort Systems USA, Inc.