| __timestamp | Global Payments Inc. | Pool Corporation |
|---|---|---|
| Wednesday, January 1, 2014 | 1751611000 | 643340000 |
| Thursday, January 1, 2015 | 1750511000 | 675644000 |
| Friday, January 1, 2016 | 1767444000 | 741087000 |
| Sunday, January 1, 2017 | 2047126000 | 805289000 |
| Monday, January 1, 2018 | 2271352000 | 870173000 |
| Tuesday, January 1, 2019 | 2838089000 | 924925000 |
| Wednesday, January 1, 2020 | 3772831000 | 1130902000 |
| Friday, January 1, 2021 | 4750037000 | 1617092000 |
| Saturday, January 1, 2022 | 5196898000 | 1933412000 |
| Sunday, January 1, 2023 | 5926898000 | 1660044000 |
| Monday, January 1, 2024 | 6345778000 |
Unveiling the hidden dimensions of data
In the ever-evolving landscape of financial services and consumer goods, Global Payments Inc. and Pool Corporation have demonstrated remarkable growth over the past decade. From 2014 to 2023, Global Payments Inc. has seen its gross profit soar by approximately 238%, reflecting its strategic expansions and technological advancements. Meanwhile, Pool Corporation, a leader in the pool supply industry, has achieved a commendable 158% increase in gross profit, driven by rising consumer demand and market penetration.
These insights underscore the dynamic nature of these industries and the strategic maneuvers that have propelled these companies forward.
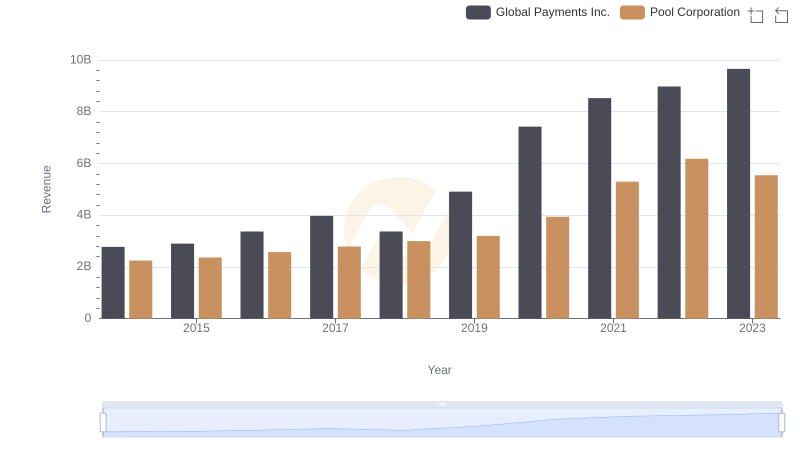
Revenue Showdown: Global Payments Inc. vs Pool Corporation
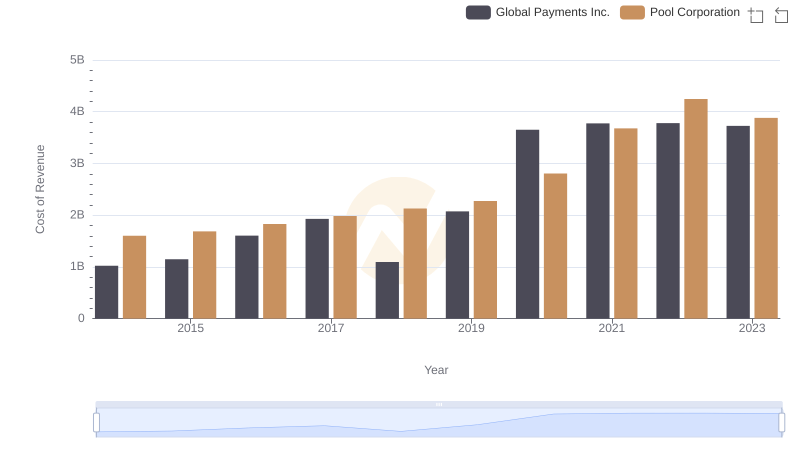
Global Payments Inc. vs Pool Corporation: Efficiency in Cost of Revenue Explored
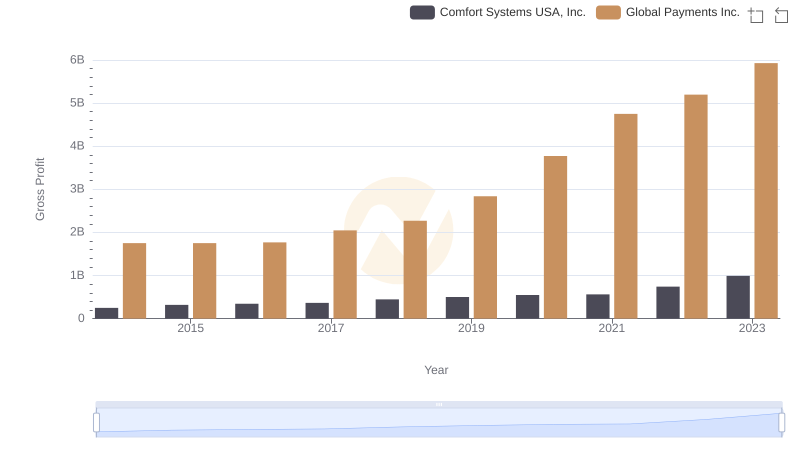
Who Generates Higher Gross Profit? Global Payments Inc. or Comfort Systems USA, Inc.
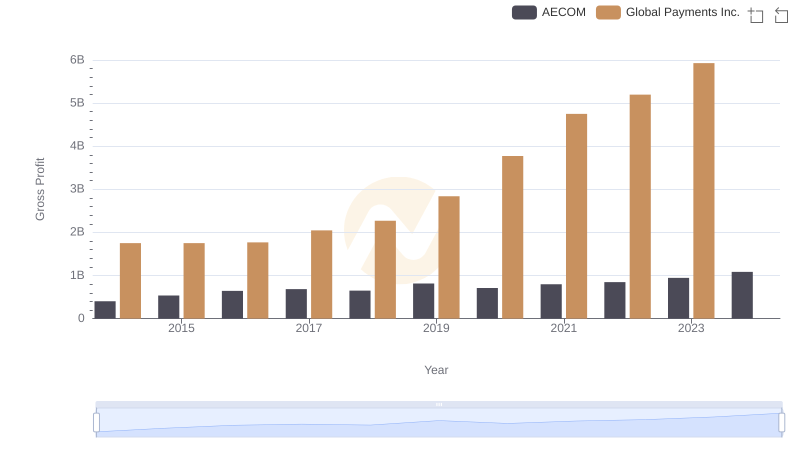
Global Payments Inc. and AECOM: A Detailed Gross Profit Analysis
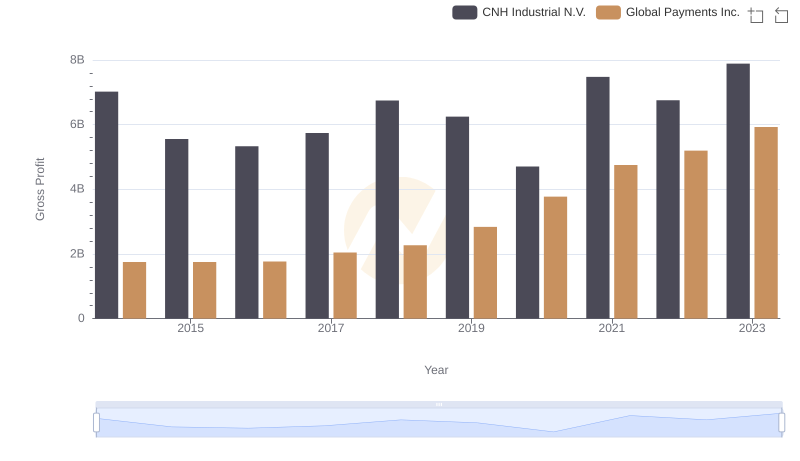
Key Insights on Gross Profit: Global Payments Inc. vs CNH Industrial N.V.
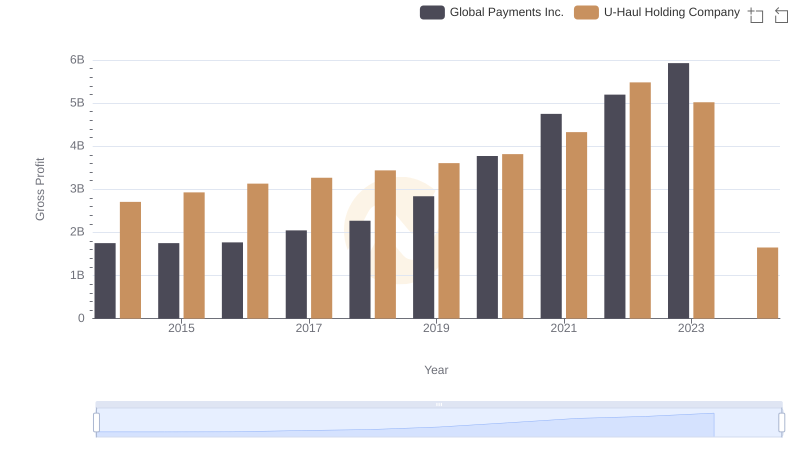
Gross Profit Comparison: Global Payments Inc. and U-Haul Holding Company Trends
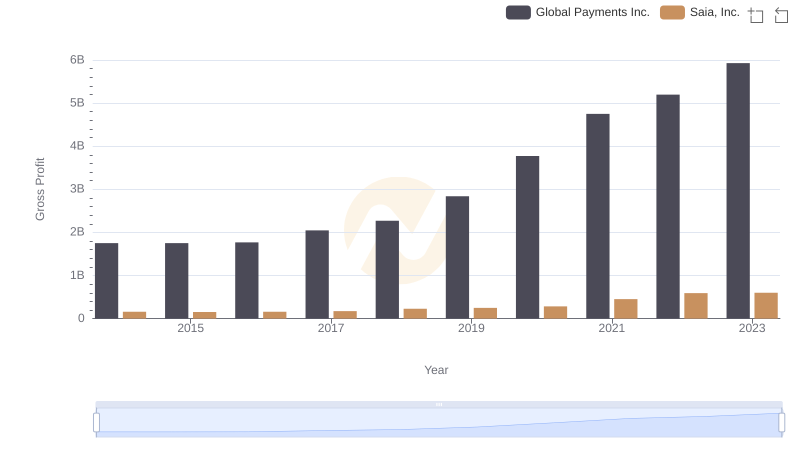
Who Generates Higher Gross Profit? Global Payments Inc. or Saia, Inc.
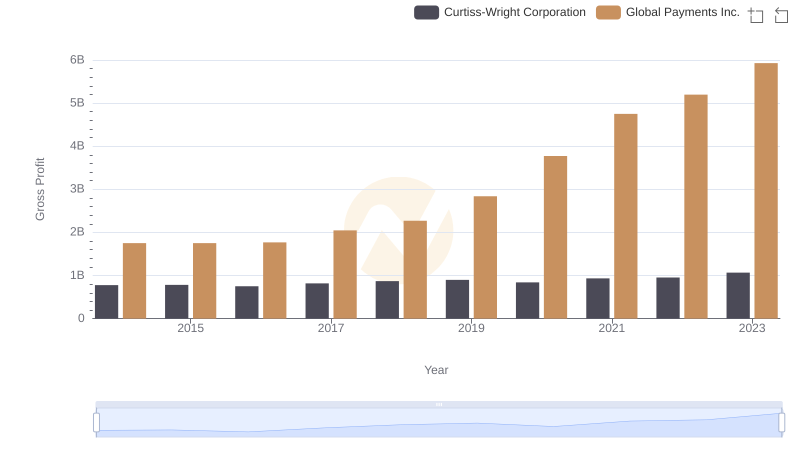
Global Payments Inc. vs Curtiss-Wright Corporation: A Gross Profit Performance Breakdown
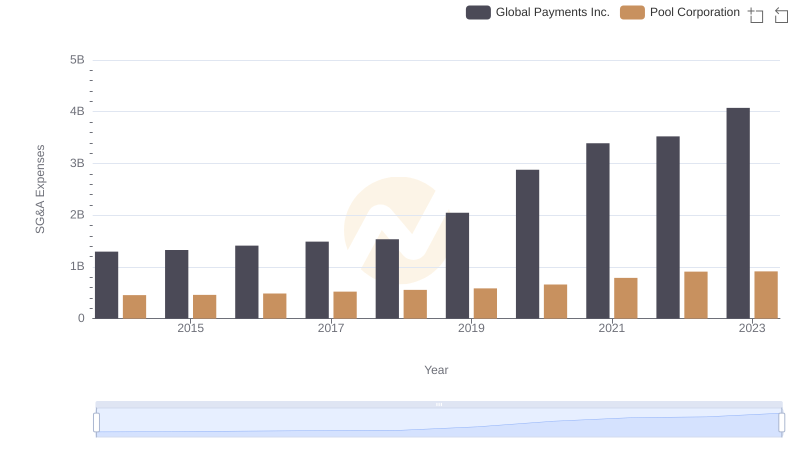
Comparing SG&A Expenses: Global Payments Inc. vs Pool Corporation Trends and Insights