| __timestamp | Equifax Inc. | HEICO Corporation |
|---|---|---|
| Wednesday, January 1, 2014 | 844700000 | 733999000 |
| Thursday, January 1, 2015 | 887400000 | 754469000 |
| Friday, January 1, 2016 | 1113400000 | 860766000 |
| Sunday, January 1, 2017 | 1210700000 | 950088000 |
| Monday, January 1, 2018 | 1440400000 | 1087006000 |
| Tuesday, January 1, 2019 | 1521700000 | 1241807000 |
| Wednesday, January 1, 2020 | 1737400000 | 1104882000 |
| Friday, January 1, 2021 | 1980900000 | 1138259000 |
| Saturday, January 1, 2022 | 2177200000 | 1345563000 |
| Sunday, January 1, 2023 | 2335100000 | 1814617000 |
| Monday, January 1, 2024 | 0 | 2355943000 |
In pursuit of knowledge
In the ever-evolving landscape of corporate finance, understanding cost efficiency is paramount. This analysis delves into the cost of revenue trends for Equifax Inc. and HEICO Corporation from 2014 to 2023. Over this decade, Equifax's cost of revenue surged by approximately 176%, peaking in 2023. Meanwhile, HEICO Corporation demonstrated a more consistent growth, with a notable 148% increase over the same period.
Equifax's cost efficiency journey reflects a steady climb, with significant jumps post-2018, indicating strategic investments or operational shifts. In contrast, HEICO's trajectory, while also upward, shows a more balanced approach, with a remarkable spike in 2024, suggesting potential expansion or increased operational costs.
This comparative analysis not only highlights the financial strategies of these giants but also offers insights into their operational efficiencies, providing a valuable perspective for investors and industry analysts alike.
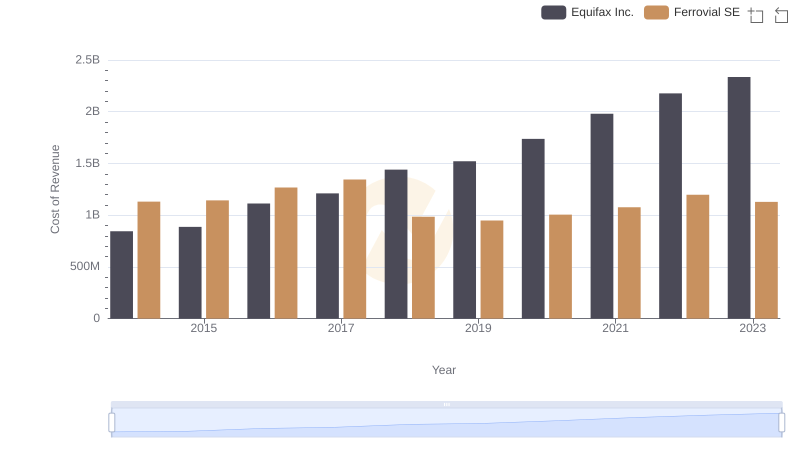
Comparing Cost of Revenue Efficiency: Equifax Inc. vs Ferrovial SE
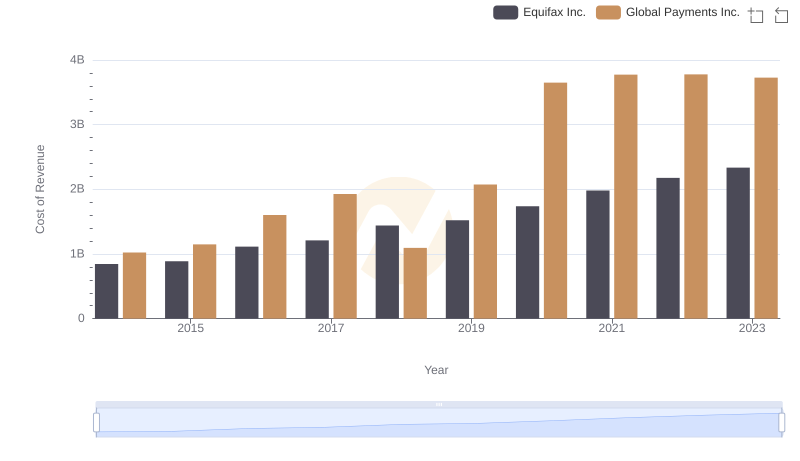
Comparing Cost of Revenue Efficiency: Equifax Inc. vs Global Payments Inc.
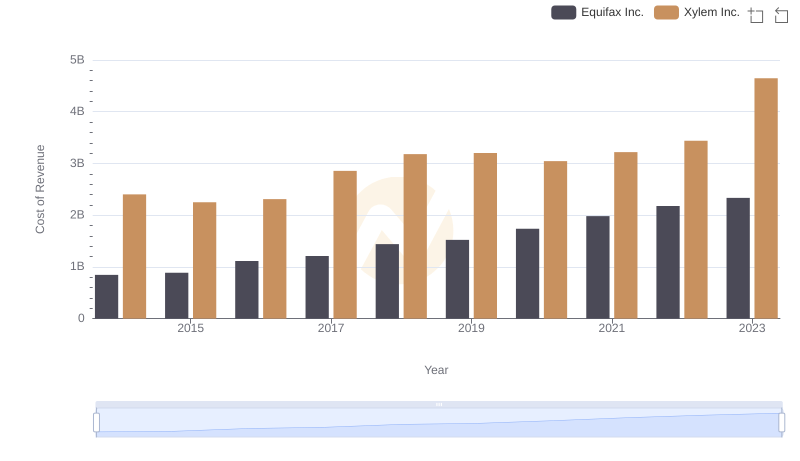
Analyzing Cost of Revenue: Equifax Inc. and Xylem Inc.
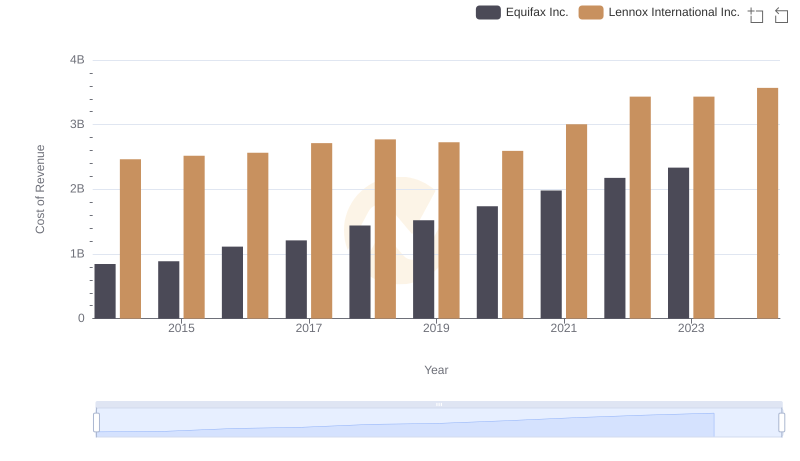
Cost of Revenue Comparison: Equifax Inc. vs Lennox International Inc.
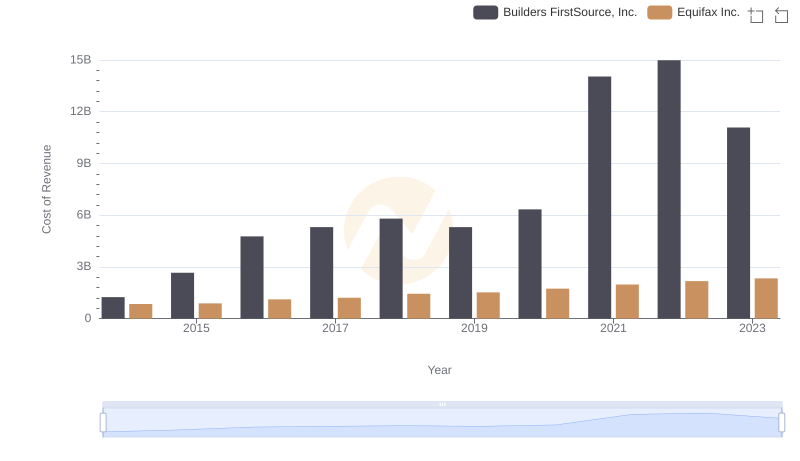
Cost Insights: Breaking Down Equifax Inc. and Builders FirstSource, Inc.'s Expenses
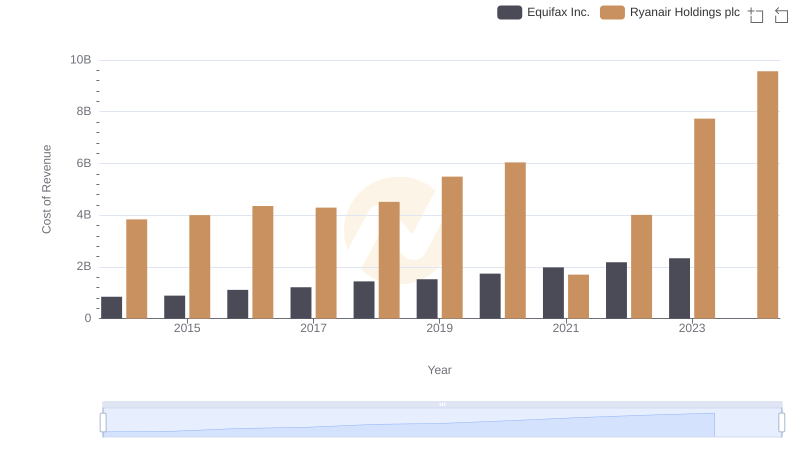
Equifax Inc. vs Ryanair Holdings plc: Efficiency in Cost of Revenue Explored
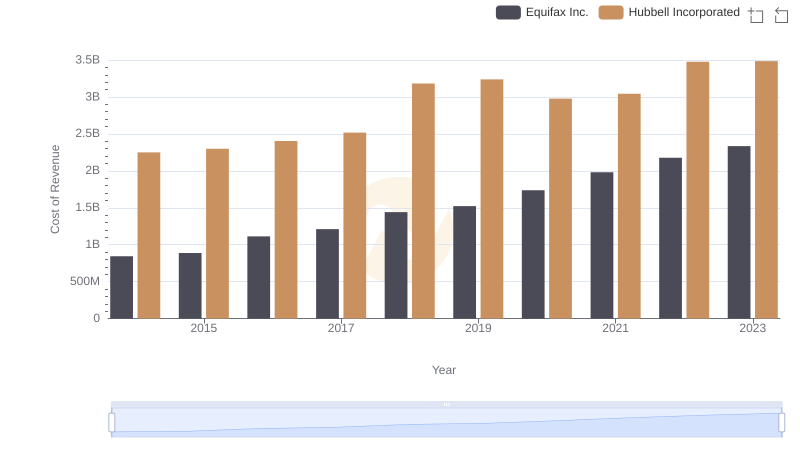
Cost Insights: Breaking Down Equifax Inc. and Hubbell Incorporated's Expenses
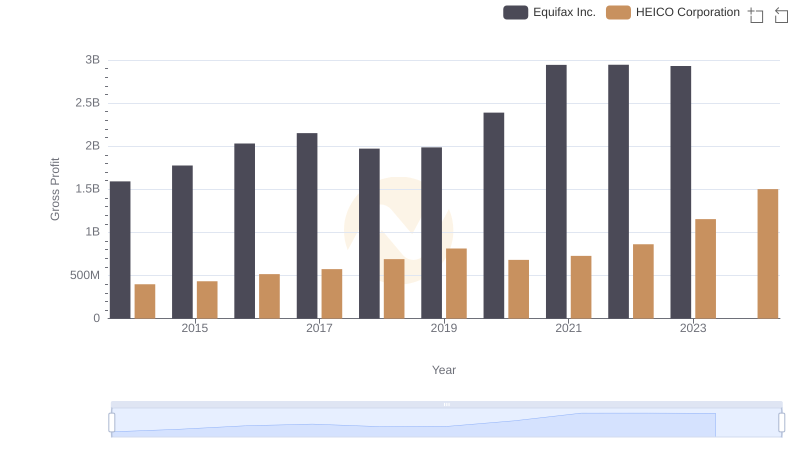
Gross Profit Comparison: Equifax Inc. and HEICO Corporation Trends
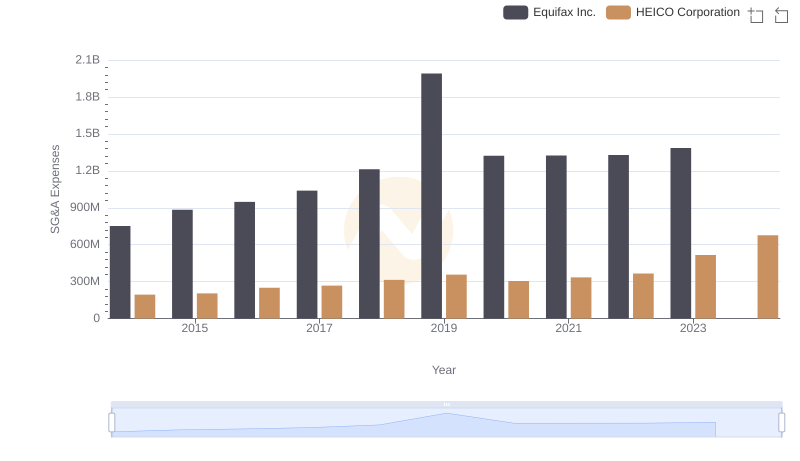
Comparing SG&A Expenses: Equifax Inc. vs HEICO Corporation Trends and Insights