| __timestamp | Automatic Data Processing, Inc. | Hubbell Incorporated |
|---|---|---|
| Wednesday, January 1, 2014 | 4611400000 | 1109000000 |
| Thursday, January 1, 2015 | 4133200000 | 1091800000 |
| Friday, January 1, 2016 | 4450200000 | 1100700000 |
| Sunday, January 1, 2017 | 4712600000 | 1151900000 |
| Monday, January 1, 2018 | 5016700000 | 1300400000 |
| Tuesday, January 1, 2019 | 5526700000 | 1352700000 |
| Wednesday, January 1, 2020 | 6144700000 | 1209300000 |
| Friday, January 1, 2021 | 6365100000 | 1151500000 |
| Saturday, January 1, 2022 | 7036400000 | 1471600000 |
| Sunday, January 1, 2023 | 8058800000 | 1888100000 |
| Monday, January 1, 2024 | 8725900000 | 1904100000 |
Unleashing insights
In the ever-evolving landscape of American industry, Automatic Data Processing, Inc. (ADP) and Hubbell Incorporated stand as titans in their respective fields. Over the past decade, ADP has demonstrated a robust growth trajectory, with its gross profit surging by approximately 89% from 2014 to 2023. This impressive growth reflects ADP's strategic innovations and market adaptability. In contrast, Hubbell Incorporated, a leader in electrical and electronic products, has shown a steady yet modest increase of around 70% in the same period. Notably, 2023 marked a significant year for Hubbell, with a gross profit peak, highlighting its resilience amidst market challenges. However, data for 2024 remains incomplete, leaving room for speculation on future trends. This comparison not only underscores the dynamic nature of these industries but also offers valuable insights into their financial health and strategic directions.
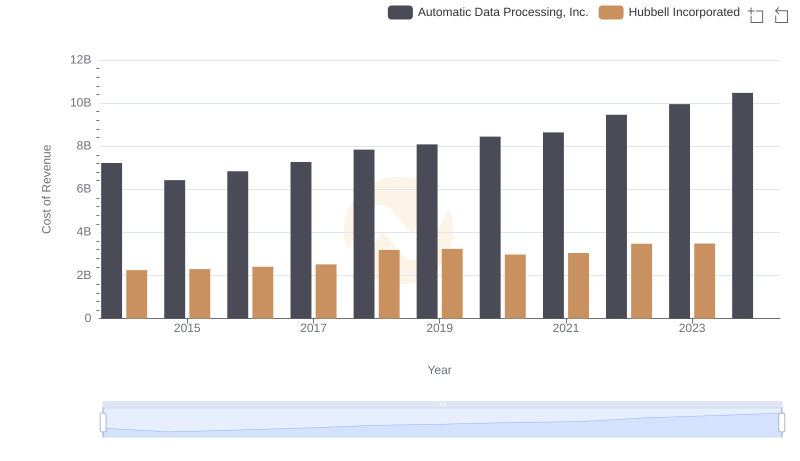
Comparing Cost of Revenue Efficiency: Automatic Data Processing, Inc. vs Hubbell Incorporated
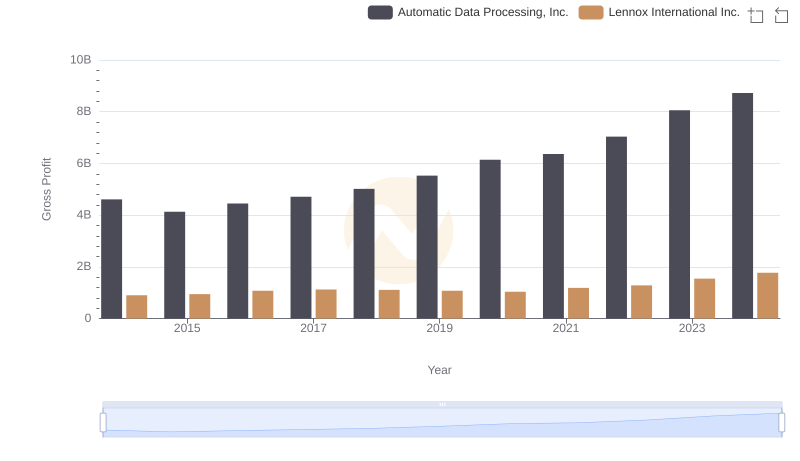
Gross Profit Comparison: Automatic Data Processing, Inc. and Lennox International Inc. Trends
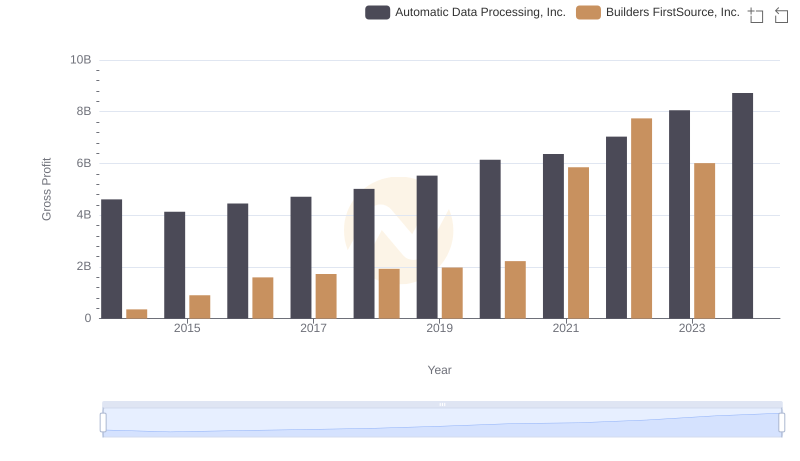
Gross Profit Comparison: Automatic Data Processing, Inc. and Builders FirstSource, Inc. Trends
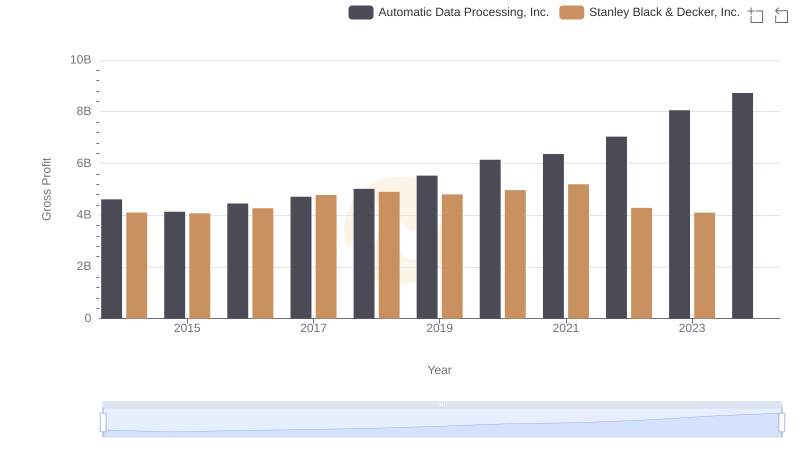
Gross Profit Analysis: Comparing Automatic Data Processing, Inc. and Stanley Black & Decker, Inc.
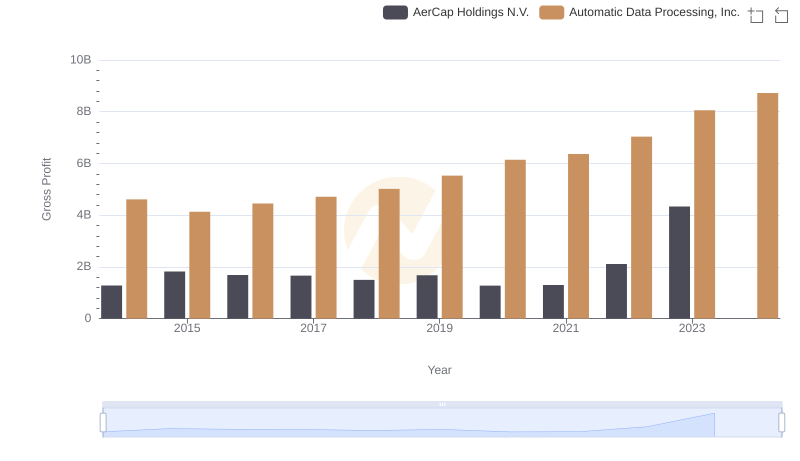
Key Insights on Gross Profit: Automatic Data Processing, Inc. vs AerCap Holdings N.V.
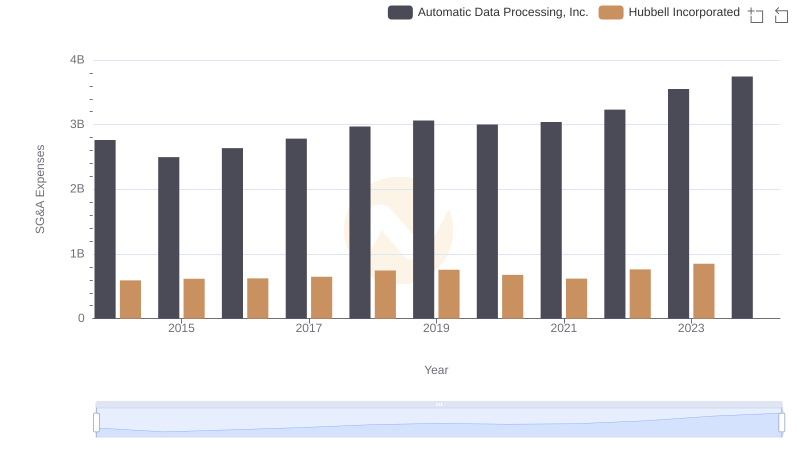
Comparing SG&A Expenses: Automatic Data Processing, Inc. vs Hubbell Incorporated Trends and Insights
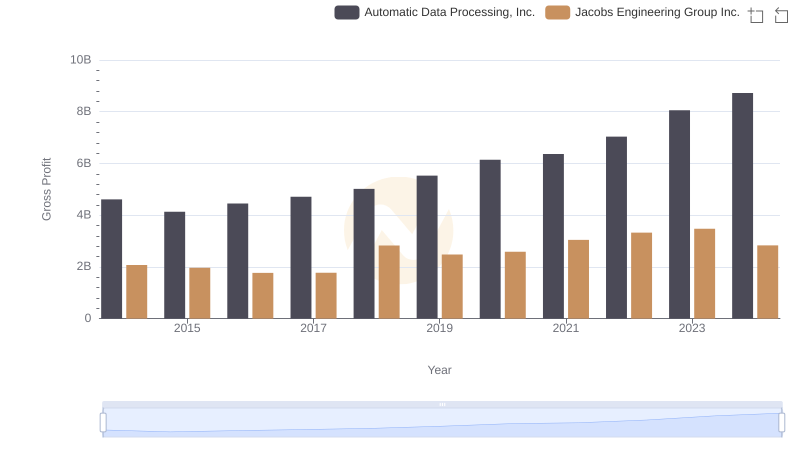
Automatic Data Processing, Inc. vs Jacobs Engineering Group Inc.: A Gross Profit Performance Breakdown
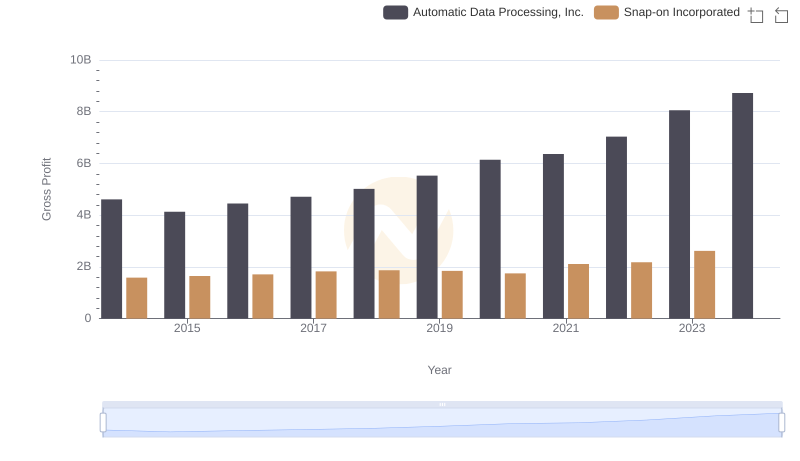
Automatic Data Processing, Inc. and Snap-on Incorporated: A Detailed Gross Profit Analysis
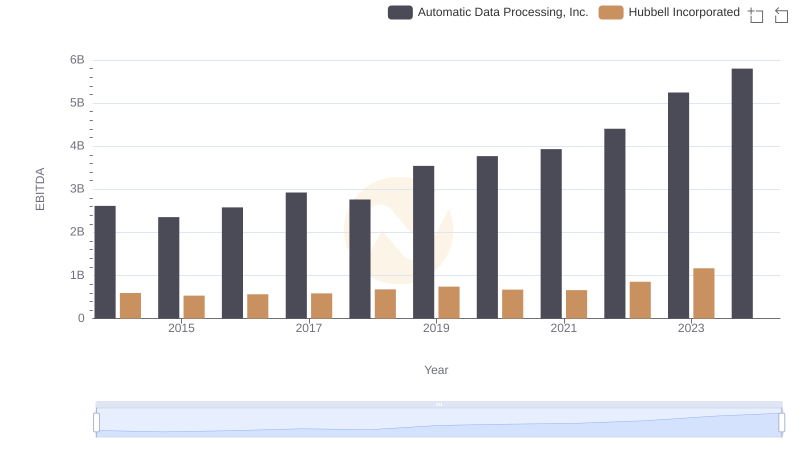
EBITDA Performance Review: Automatic Data Processing, Inc. vs Hubbell Incorporated