| __timestamp | Automatic Data Processing, Inc. | Builders FirstSource, Inc. |
|---|---|---|
| Wednesday, January 1, 2014 | 4611400000 | 356997000 |
| Thursday, January 1, 2015 | 4133200000 | 901458000 |
| Friday, January 1, 2016 | 4450200000 | 1596748000 |
| Sunday, January 1, 2017 | 4712600000 | 1727391000 |
| Monday, January 1, 2018 | 5016700000 | 1922940000 |
| Tuesday, January 1, 2019 | 5526700000 | 1976829000 |
| Wednesday, January 1, 2020 | 6144700000 | 2222584000 |
| Friday, January 1, 2021 | 6365100000 | 5850956000 |
| Saturday, January 1, 2022 | 7036400000 | 7744379000 |
| Sunday, January 1, 2023 | 8058800000 | 6012334000 |
| Monday, January 1, 2024 | 8725900000 |
Cracking the code
In the ever-evolving landscape of the U.S. stock market, understanding the financial health of companies is crucial. This analysis delves into the gross profit trends of Automatic Data Processing, Inc. (ADP) and Builders FirstSource, Inc. (BLDR) from 2014 to 2023. Over this period, ADP has consistently demonstrated robust growth, with its gross profit increasing by approximately 89%, from $4.6 billion in 2014 to $8.1 billion in 2023. This steady rise underscores ADP's resilience and strategic prowess in the competitive business services sector.
Conversely, Builders FirstSource, Inc. has shown a more volatile trajectory. From a modest $357 million in 2014, its gross profit surged to a peak of $7.7 billion in 2022, reflecting a remarkable growth of over 2000%. However, 2023 saw a decline to $6 billion, indicating potential challenges in the construction materials industry. Notably, data for 2024 is missing, leaving room for speculation on future trends.
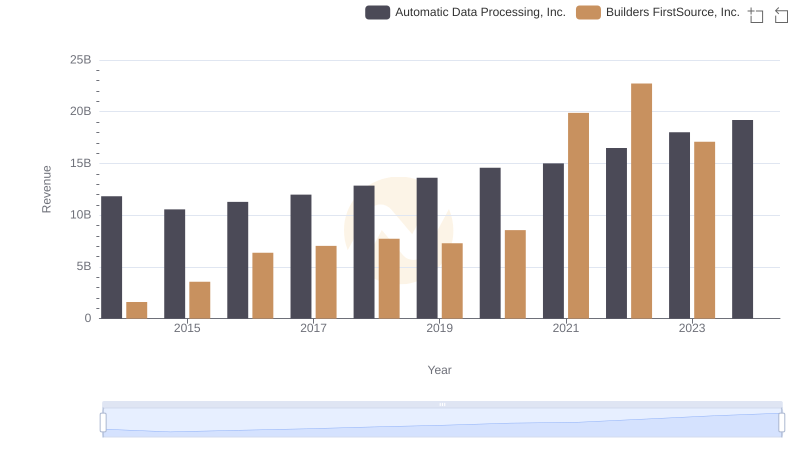
Who Generates More Revenue? Automatic Data Processing, Inc. or Builders FirstSource, Inc.
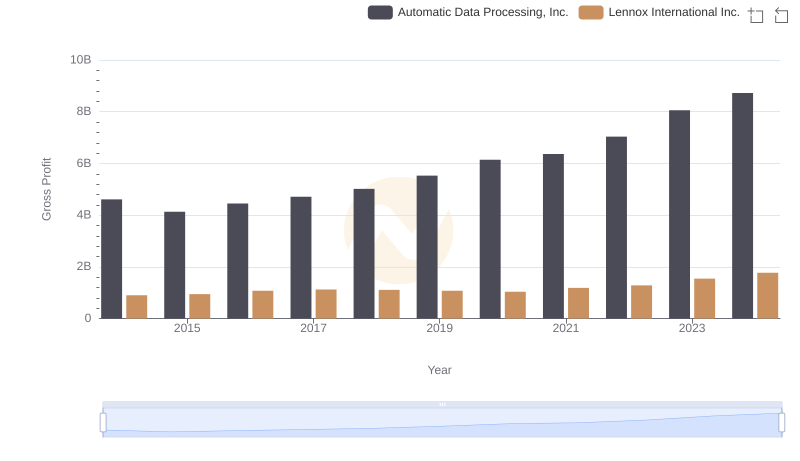
Gross Profit Comparison: Automatic Data Processing, Inc. and Lennox International Inc. Trends

Gross Profit Comparison: Automatic Data Processing, Inc. and Hubbell Incorporated Trends
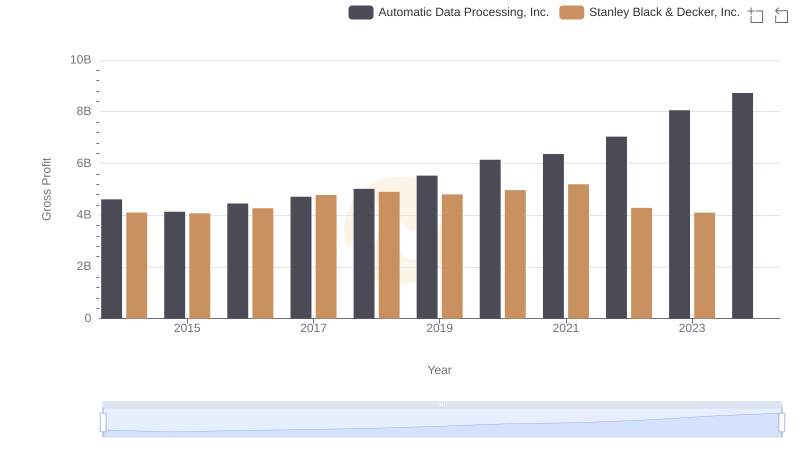
Gross Profit Analysis: Comparing Automatic Data Processing, Inc. and Stanley Black & Decker, Inc.
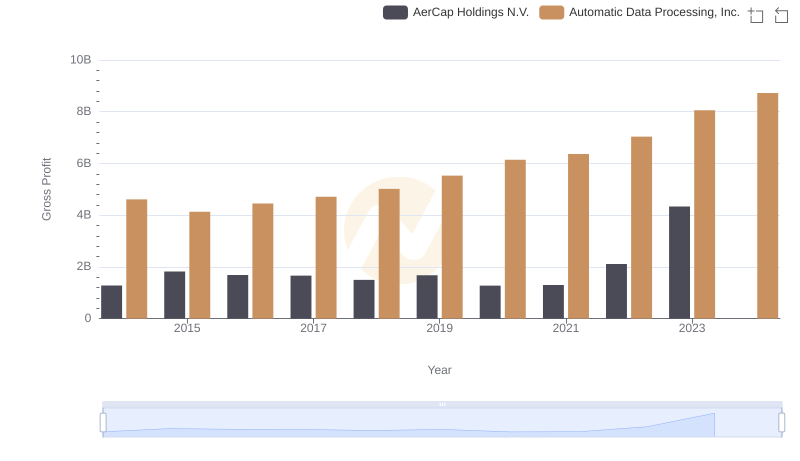
Key Insights on Gross Profit: Automatic Data Processing, Inc. vs AerCap Holdings N.V.
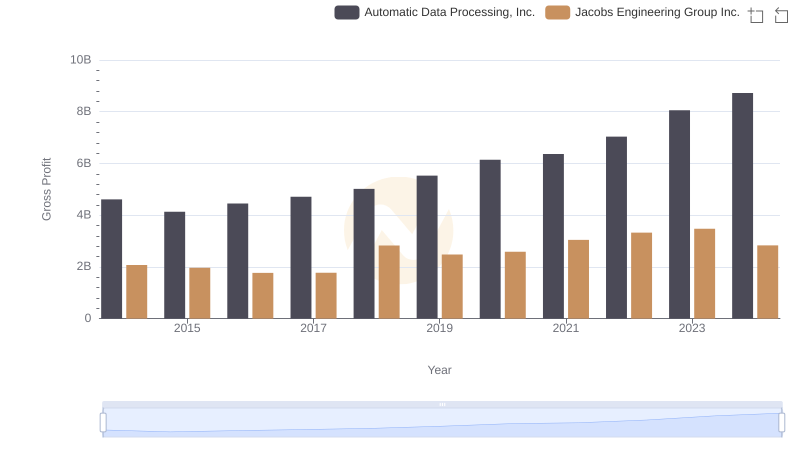
Automatic Data Processing, Inc. vs Jacobs Engineering Group Inc.: A Gross Profit Performance Breakdown
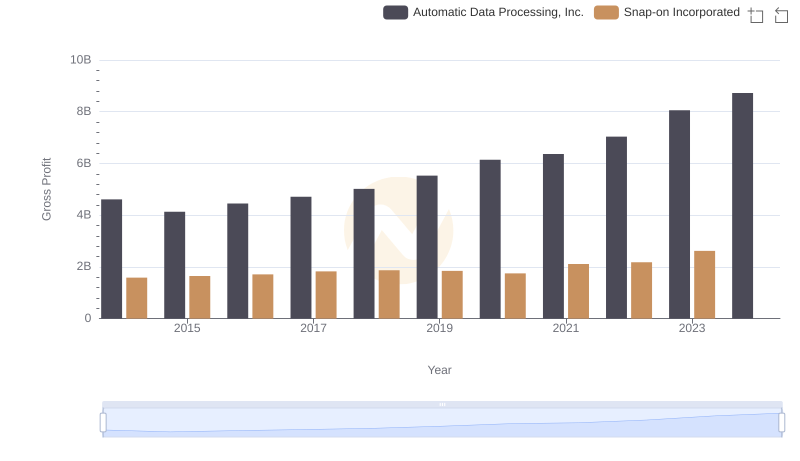
Automatic Data Processing, Inc. and Snap-on Incorporated: A Detailed Gross Profit Analysis