| __timestamp | Automatic Data Processing, Inc. | Lennox International Inc. |
|---|---|---|
| Wednesday, January 1, 2014 | 4611400000 | 903300000 |
| Thursday, January 1, 2015 | 4133200000 | 947400000 |
| Friday, January 1, 2016 | 4450200000 | 1076500000 |
| Sunday, January 1, 2017 | 4712600000 | 1125200000 |
| Monday, January 1, 2018 | 5016700000 | 1111200000 |
| Tuesday, January 1, 2019 | 5526700000 | 1079800000 |
| Wednesday, January 1, 2020 | 6144700000 | 1040100000 |
| Friday, January 1, 2021 | 6365100000 | 1188400000 |
| Saturday, January 1, 2022 | 7036400000 | 1284700000 |
| Sunday, January 1, 2023 | 8058800000 | 1547800000 |
| Monday, January 1, 2024 | 8725900000 | 1771900000 |
Cracking the code
In the ever-evolving landscape of the U.S. stock market, understanding the financial health of companies is crucial. This analysis delves into the gross profit trends of Automatic Data Processing, Inc. (ADP) and Lennox International Inc. (LII) from 2014 to 2024. Over this decade, ADP has consistently outperformed LII, showcasing a robust growth trajectory. Starting at approximately $4.6 billion in 2014, ADP's gross profit surged by nearly 90% to reach $8.7 billion in 2024. In contrast, LII's gross profit, while growing, increased by about 96% from $903 million to $1.77 billion in the same period. This comparison highlights ADP's dominant market position and strategic growth initiatives. As we look to the future, these trends offer valuable insights for investors and stakeholders aiming to make informed decisions in the competitive world of finance.

Comparing Revenue Performance: Automatic Data Processing, Inc. or Lennox International Inc.?
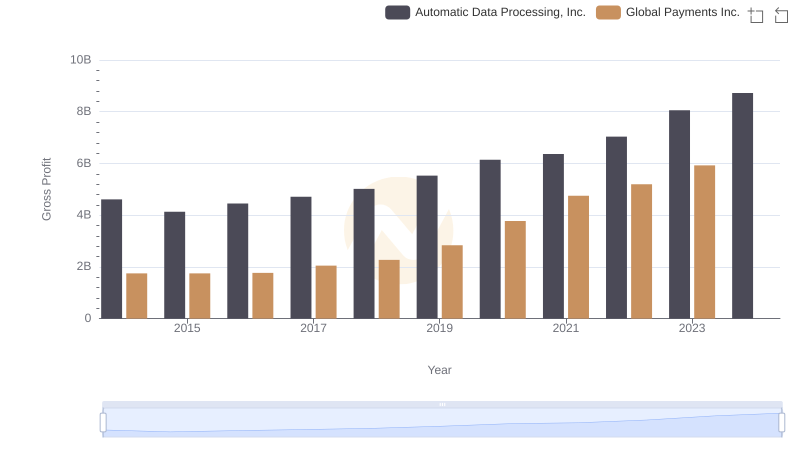
Automatic Data Processing, Inc. and Global Payments Inc.: A Detailed Gross Profit Analysis
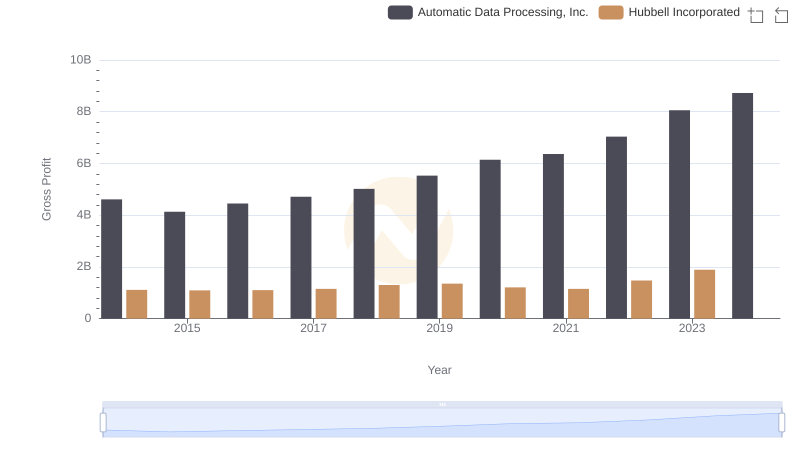
Gross Profit Comparison: Automatic Data Processing, Inc. and Hubbell Incorporated Trends
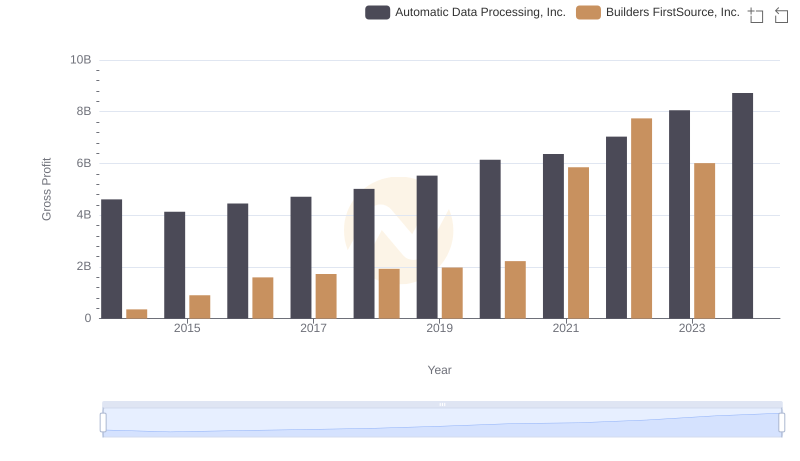
Gross Profit Comparison: Automatic Data Processing, Inc. and Builders FirstSource, Inc. Trends
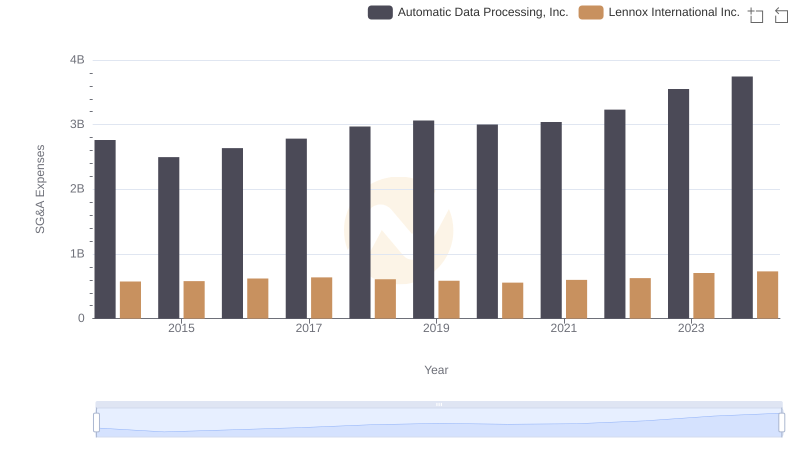
Who Optimizes SG&A Costs Better? Automatic Data Processing, Inc. or Lennox International Inc.
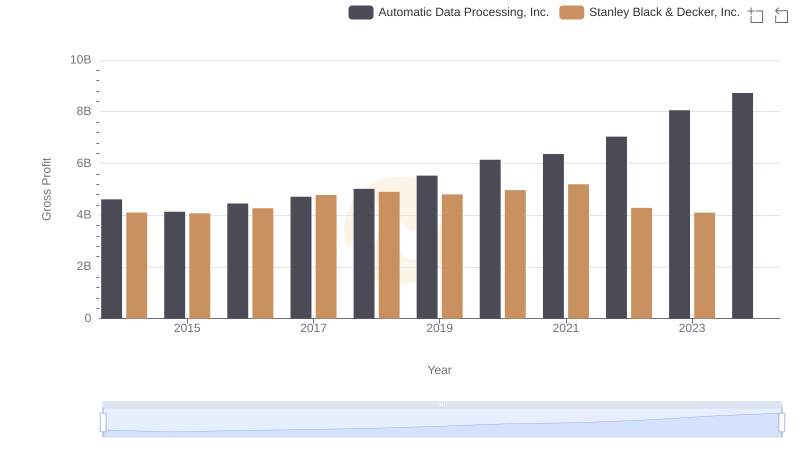
Gross Profit Analysis: Comparing Automatic Data Processing, Inc. and Stanley Black & Decker, Inc.
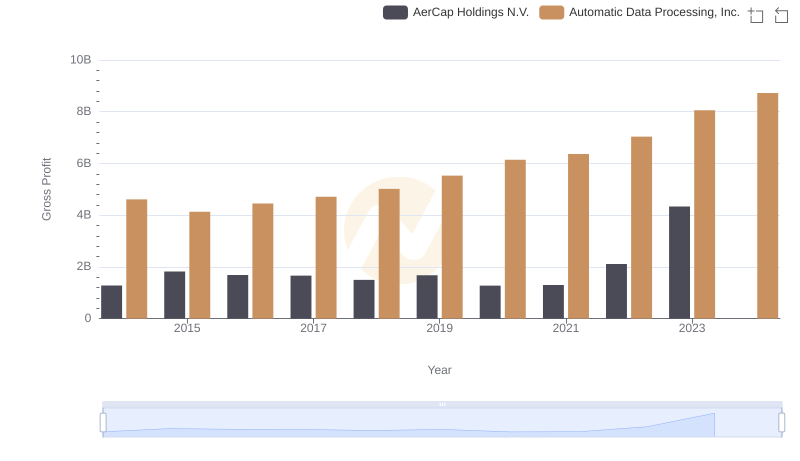
Key Insights on Gross Profit: Automatic Data Processing, Inc. vs AerCap Holdings N.V.
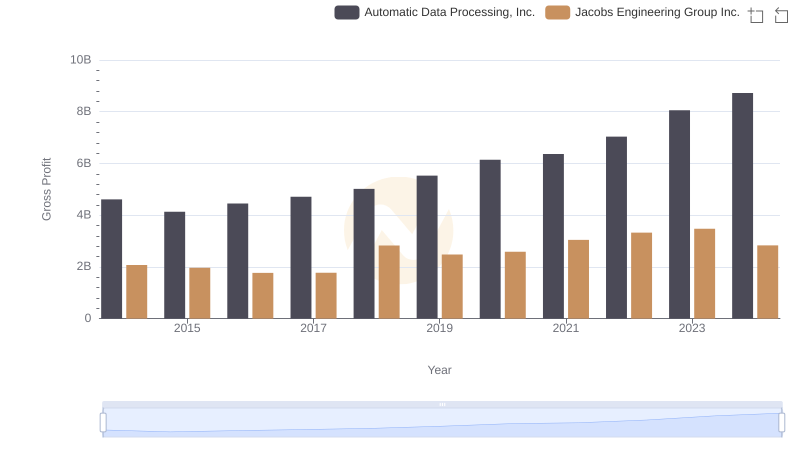
Automatic Data Processing, Inc. vs Jacobs Engineering Group Inc.: A Gross Profit Performance Breakdown