| __timestamp | Axon Enterprise, Inc. | C.H. Robinson Worldwide, Inc. |
|---|---|---|
| Wednesday, January 1, 2014 | 101548000 | 1068631000 |
| Thursday, January 1, 2015 | 128647000 | 1217070000 |
| Friday, January 1, 2016 | 170536000 | 1212592000 |
| Sunday, January 1, 2017 | 207088000 | 1188523000 |
| Monday, January 1, 2018 | 258583000 | 1361693000 |
| Tuesday, January 1, 2019 | 307286000 | 1287782000 |
| Wednesday, January 1, 2020 | 416331000 | 1169390000 |
| Friday, January 1, 2021 | 540910000 | 1608479000 |
| Saturday, January 1, 2022 | 728638000 | 1870197000 |
| Sunday, January 1, 2023 | 955382000 | 1138873000 |
| Monday, January 1, 2024 | 1308765000 |
Igniting the spark of knowledge
In the ever-evolving landscape of American business, the financial trajectories of Axon Enterprise, Inc. and C.H. Robinson Worldwide, Inc. offer a fascinating study in contrasts. Over the past decade, Axon has demonstrated a remarkable growth trajectory, with its gross profit increasing nearly tenfold from 2014 to 2023. This represents an impressive annual growth rate, highlighting Axon's strategic prowess in the tech-driven security sector.
Conversely, C.H. Robinson, a stalwart in logistics, has shown a more stable yet significant growth pattern. Despite a dip in 2023, its gross profit surged by approximately 66% from 2014 to 2022, underscoring its resilience in a competitive market. However, the data for 2024 suggests a dramatic spike, which may indicate missing or anomalous data.
These trends reflect broader industry dynamics, with tech companies like Axon capitalizing on innovation, while traditional sectors like logistics maintain steady growth.
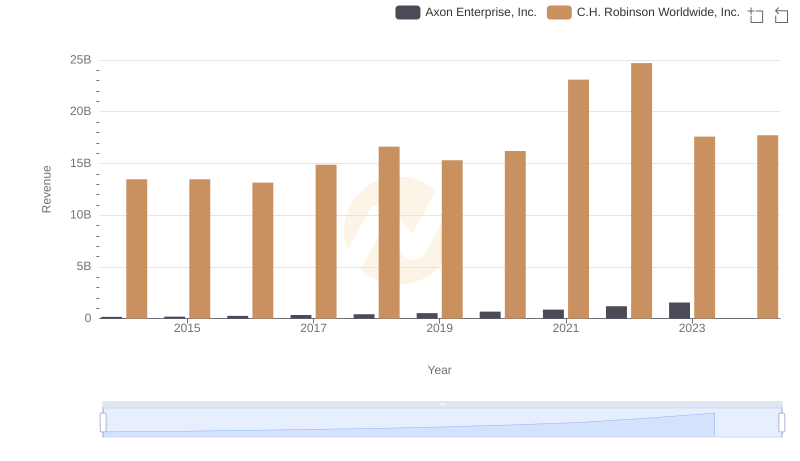
Annual Revenue Comparison: Axon Enterprise, Inc. vs C.H. Robinson Worldwide, Inc.
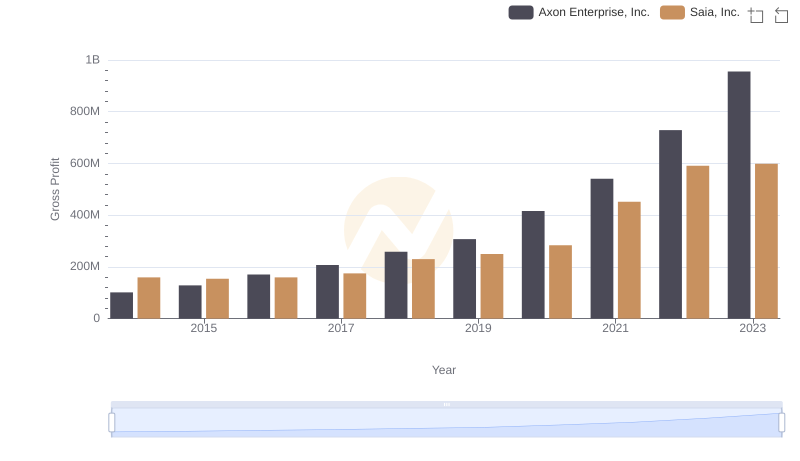
Gross Profit Comparison: Axon Enterprise, Inc. and Saia, Inc. Trends
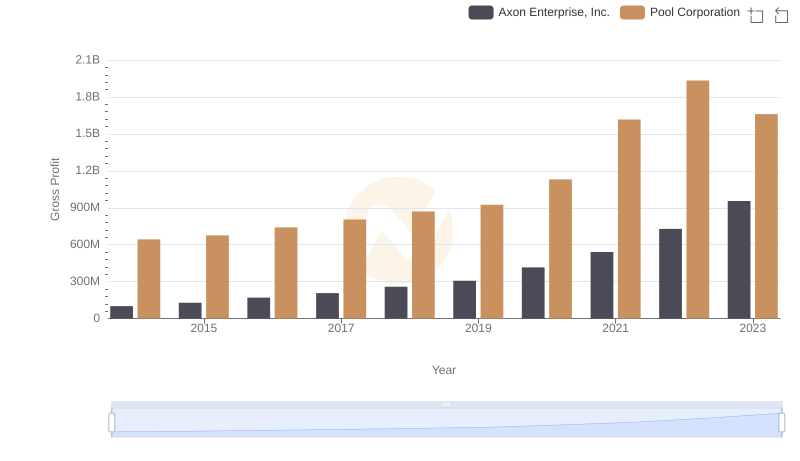
Gross Profit Analysis: Comparing Axon Enterprise, Inc. and Pool Corporation
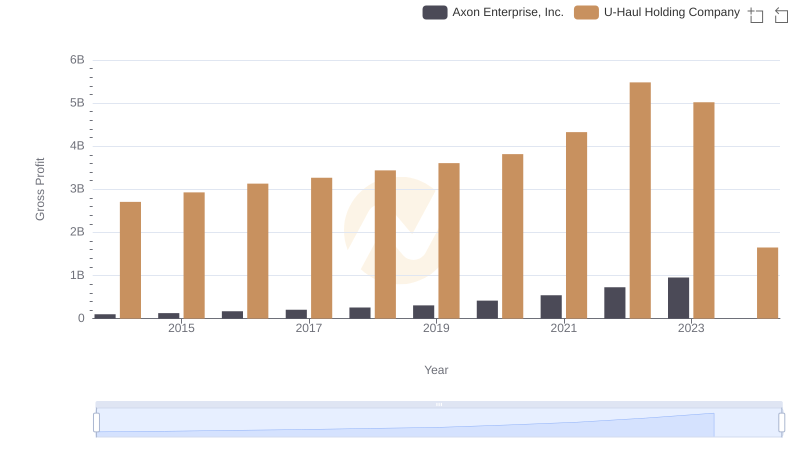
Gross Profit Analysis: Comparing Axon Enterprise, Inc. and U-Haul Holding Company
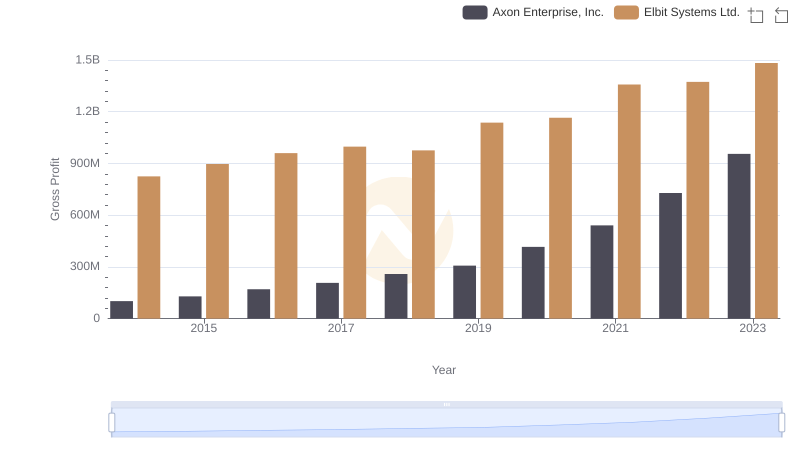
Gross Profit Analysis: Comparing Axon Enterprise, Inc. and Elbit Systems Ltd.
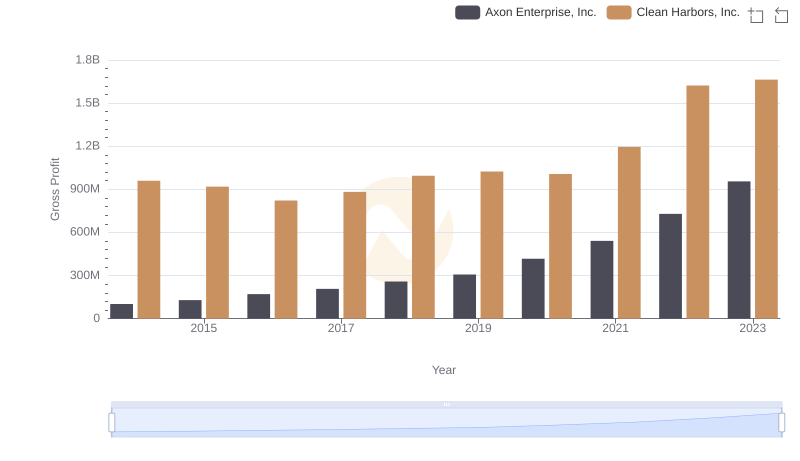
Key Insights on Gross Profit: Axon Enterprise, Inc. vs Clean Harbors, Inc.
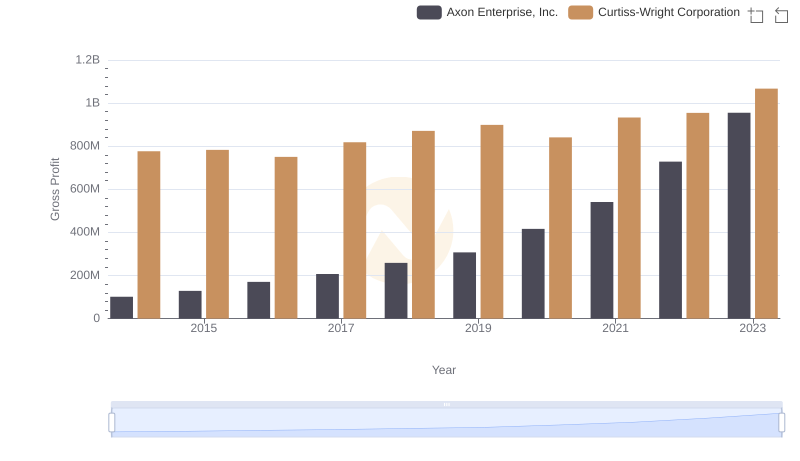
Gross Profit Trends Compared: Axon Enterprise, Inc. vs Curtiss-Wright Corporation
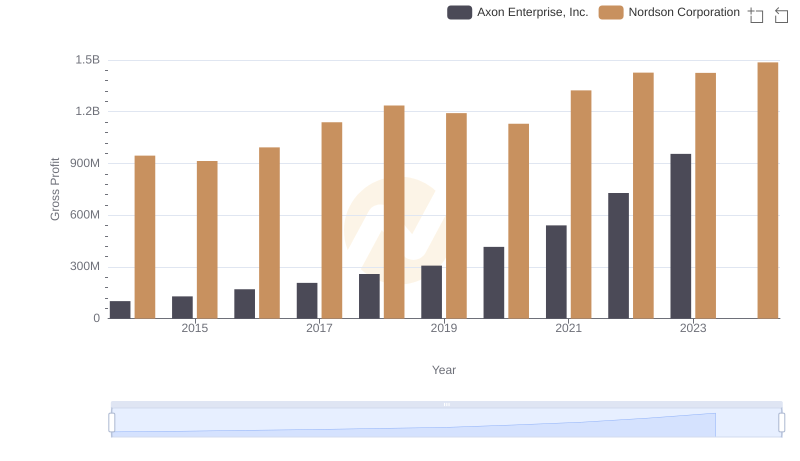
Axon Enterprise, Inc. vs Nordson Corporation: A Gross Profit Performance Breakdown
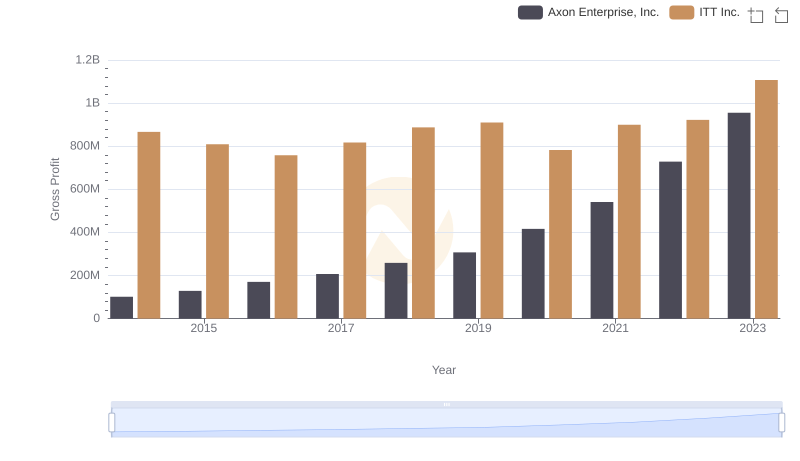
Gross Profit Analysis: Comparing Axon Enterprise, Inc. and ITT Inc.
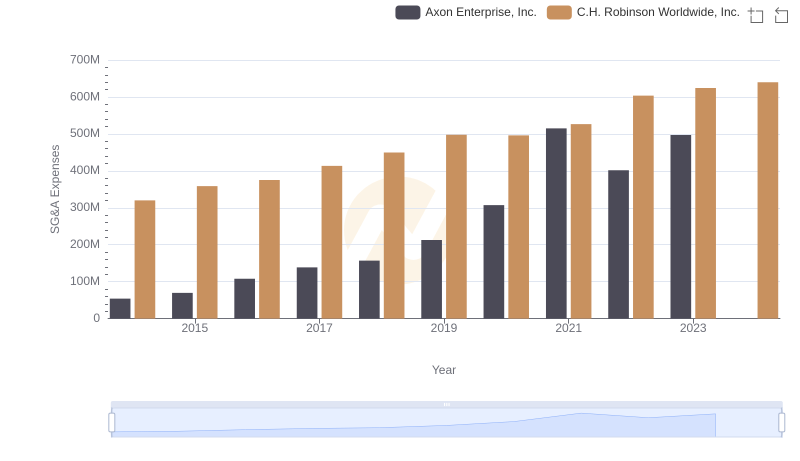
Axon Enterprise, Inc. vs C.H. Robinson Worldwide, Inc.: SG&A Expense Trends