| __timestamp | Axon Enterprise, Inc. | U-Haul Holding Company |
|---|---|---|
| Wednesday, January 1, 2014 | 101548000 | 2707982000 |
| Thursday, January 1, 2015 | 128647000 | 2928459000 |
| Friday, January 1, 2016 | 170536000 | 3130666000 |
| Sunday, January 1, 2017 | 207088000 | 3269282000 |
| Monday, January 1, 2018 | 258583000 | 3440625000 |
| Tuesday, January 1, 2019 | 307286000 | 3606565000 |
| Wednesday, January 1, 2020 | 416331000 | 3814850000 |
| Friday, January 1, 2021 | 540910000 | 4327926000 |
| Saturday, January 1, 2022 | 728638000 | 5480162000 |
| Sunday, January 1, 2023 | 955382000 | 5019797000 |
| Monday, January 1, 2024 | 1649634000 |
Infusing magic into the data realm
In the ever-evolving landscape of American business, understanding the financial health of companies is crucial. This analysis delves into the gross profit trends of two industry giants: Axon Enterprise, Inc. and U-Haul Holding Company, from 2014 to 2023. Over this decade, Axon Enterprise, Inc. has shown a remarkable growth trajectory, with its gross profit increasing by over 840%, from approximately $101 million in 2014 to nearly $956 million in 2023. In contrast, U-Haul Holding Company, a stalwart in the moving and storage industry, has maintained a steady growth, peaking at around $5.48 billion in 2022, before a slight dip in 2023. This comparison highlights Axon's aggressive growth strategy, while U-Haul's consistency underscores its resilience in a competitive market. Notably, data for 2024 is incomplete, indicating potential shifts in the coming year.
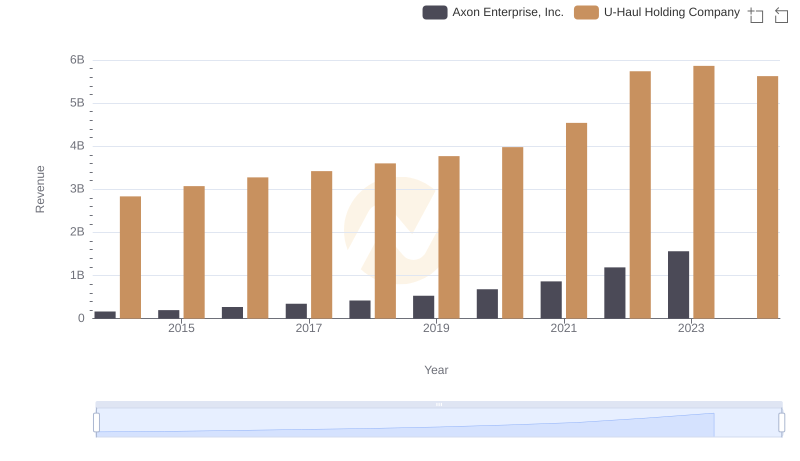
Who Generates More Revenue? Axon Enterprise, Inc. or U-Haul Holding Company
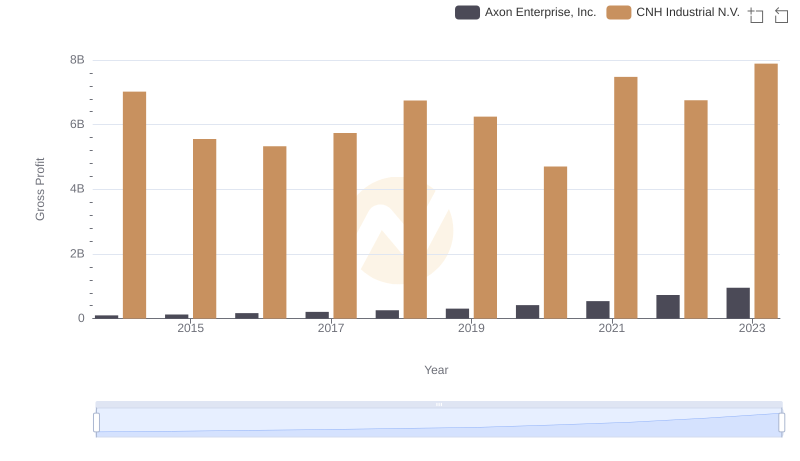
Who Generates Higher Gross Profit? Axon Enterprise, Inc. or CNH Industrial N.V.
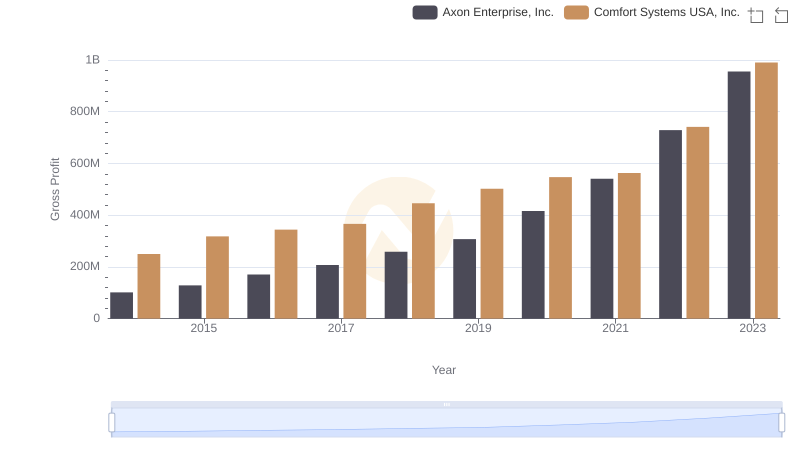
Gross Profit Comparison: Axon Enterprise, Inc. and Comfort Systems USA, Inc. Trends
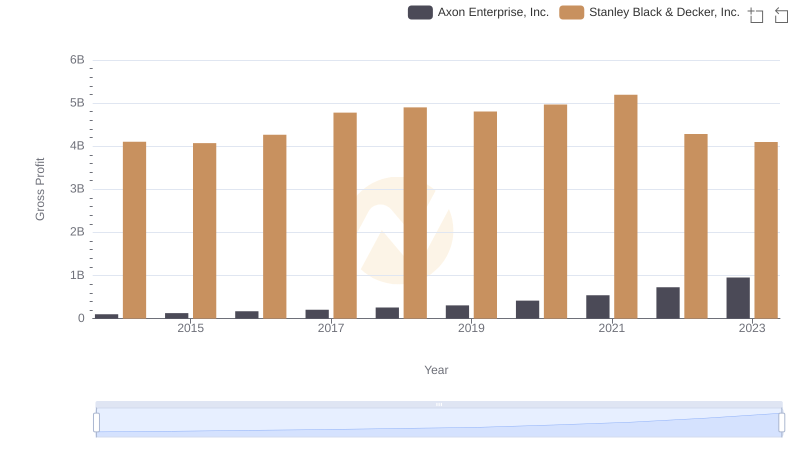
Who Generates Higher Gross Profit? Axon Enterprise, Inc. or Stanley Black & Decker, Inc.
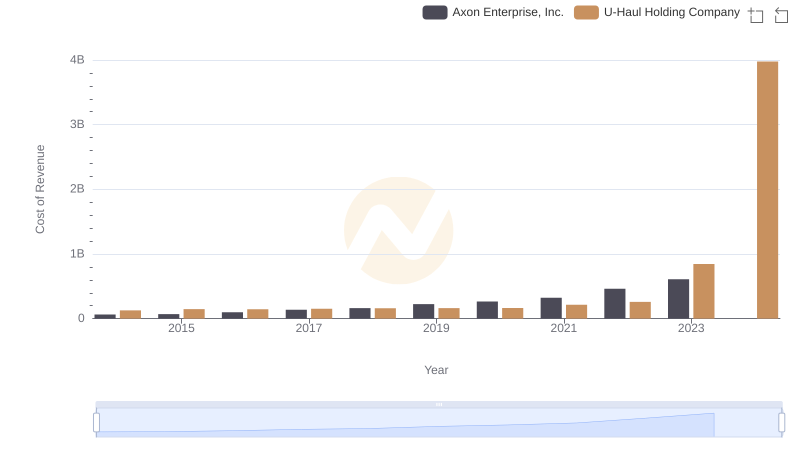
Cost Insights: Breaking Down Axon Enterprise, Inc. and U-Haul Holding Company's Expenses
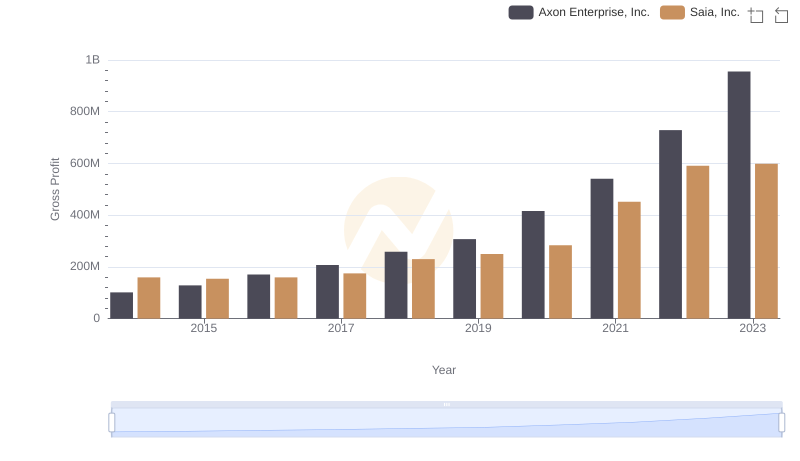
Gross Profit Comparison: Axon Enterprise, Inc. and Saia, Inc. Trends
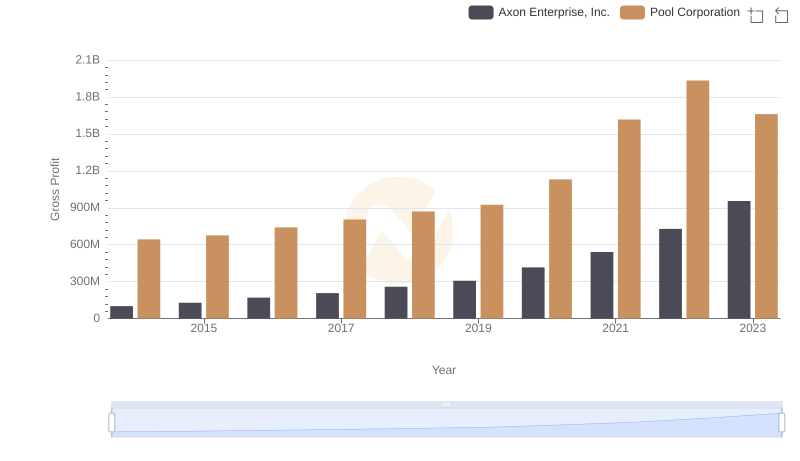
Gross Profit Analysis: Comparing Axon Enterprise, Inc. and Pool Corporation
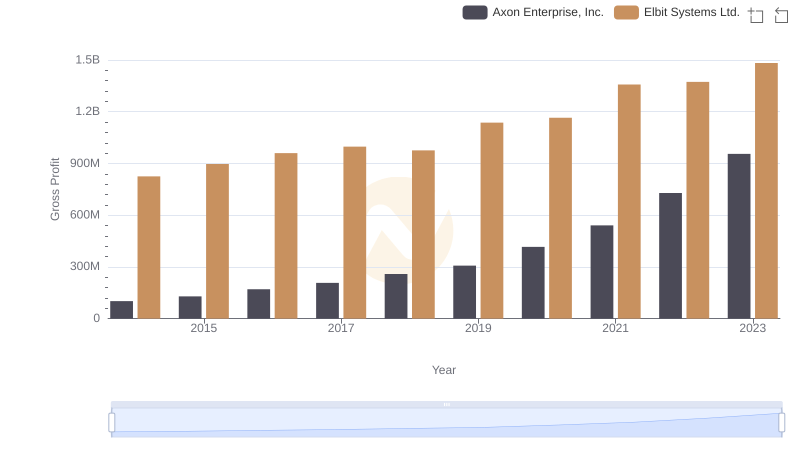
Gross Profit Analysis: Comparing Axon Enterprise, Inc. and Elbit Systems Ltd.
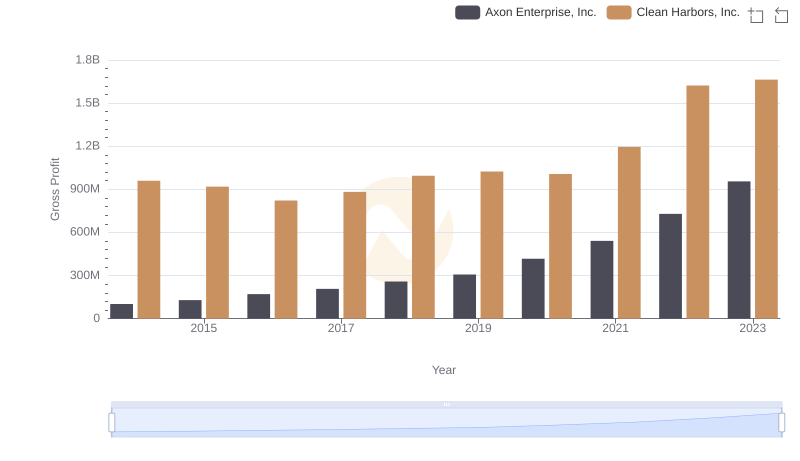
Key Insights on Gross Profit: Axon Enterprise, Inc. vs Clean Harbors, Inc.
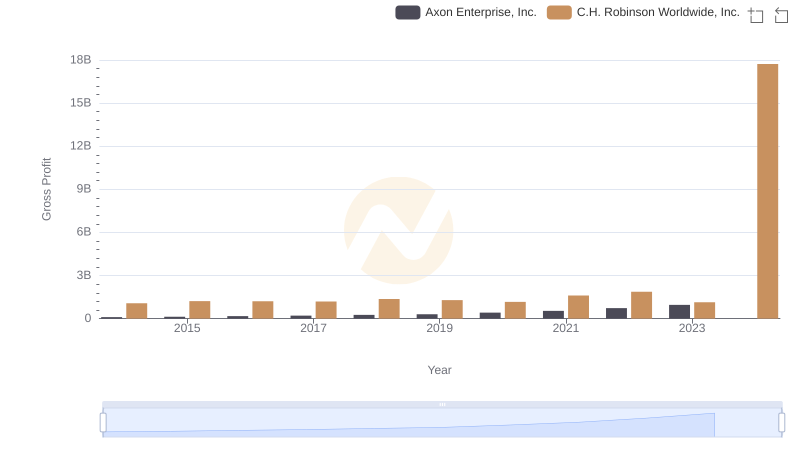
Gross Profit Trends Compared: Axon Enterprise, Inc. vs C.H. Robinson Worldwide, Inc.
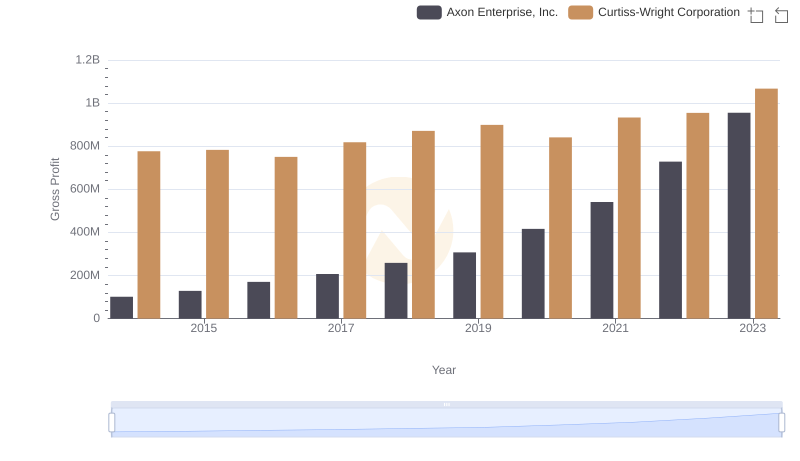
Gross Profit Trends Compared: Axon Enterprise, Inc. vs Curtiss-Wright Corporation
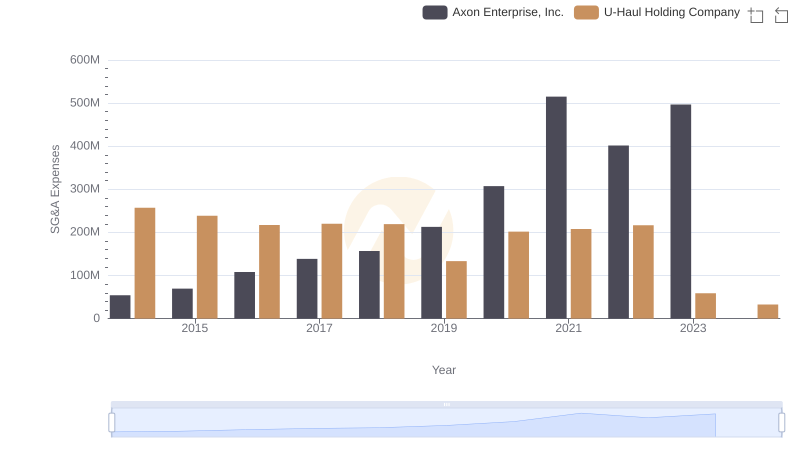
Cost Management Insights: SG&A Expenses for Axon Enterprise, Inc. and U-Haul Holding Company