| __timestamp | CNH Industrial N.V. | Global Payments Inc. |
|---|---|---|
| Wednesday, January 1, 2014 | 2925000000 | 1295014000 |
| Thursday, January 1, 2015 | 2317000000 | 1325567000 |
| Friday, January 1, 2016 | 2262000000 | 1411096000 |
| Sunday, January 1, 2017 | 2330000000 | 1488258000 |
| Monday, January 1, 2018 | 2351000000 | 1534297000 |
| Tuesday, January 1, 2019 | 2216000000 | 2046672000 |
| Wednesday, January 1, 2020 | 2155000000 | 2878878000 |
| Friday, January 1, 2021 | 2443000000 | 3391161000 |
| Saturday, January 1, 2022 | 1752000000 | 3524578000 |
| Sunday, January 1, 2023 | 1863000000 | 4073768000 |
| Monday, January 1, 2024 | 4285307000 |
Unlocking the unknown
In the competitive landscape of global business, managing Selling, General, and Administrative (SG&A) expenses is crucial for maintaining profitability. This analysis delves into the SG&A cost management of two industry giants: Global Payments Inc. and CNH Industrial N.V., from 2014 to 2023.
Global Payments Inc. has shown a significant upward trend in SG&A expenses, increasing by over 200% from 2014 to 2023. This rise reflects the company's aggressive expansion and investment strategies. In contrast, CNH Industrial N.V. has managed to reduce its SG&A costs by approximately 36% over the same period, indicating a more conservative and efficient cost management approach.
While Global Payments Inc. has seen its expenses soar, potentially impacting its bottom line, CNH Industrial N.V.'s strategic cost containment could provide a competitive edge in the long run. This comparison highlights the diverse strategies companies employ to navigate financial challenges and opportunities.
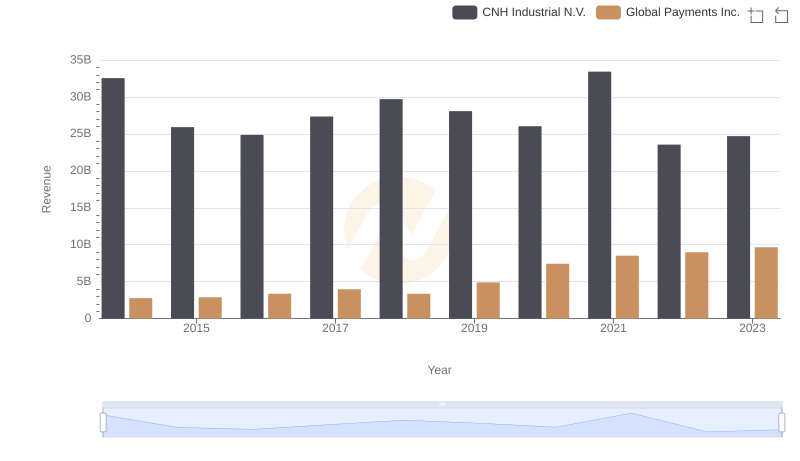
Revenue Insights: Global Payments Inc. and CNH Industrial N.V. Performance Compared
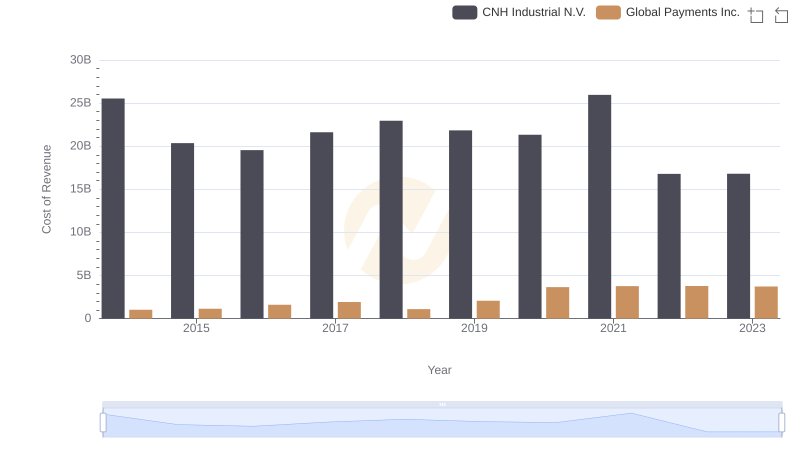
Cost of Revenue Comparison: Global Payments Inc. vs CNH Industrial N.V.
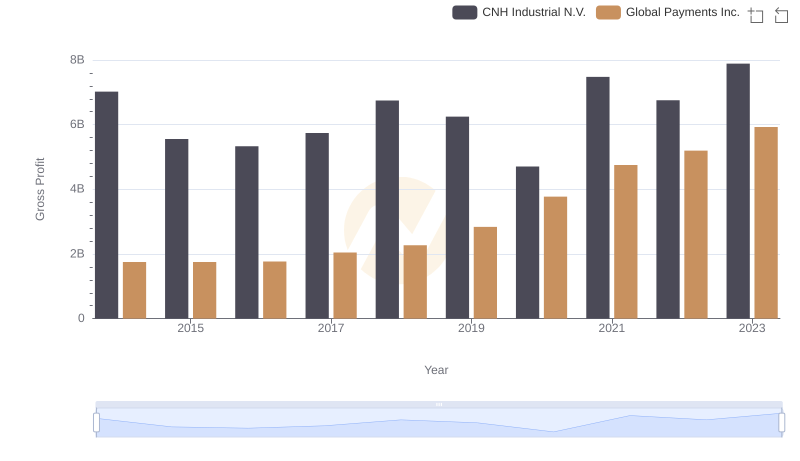
Key Insights on Gross Profit: Global Payments Inc. vs CNH Industrial N.V.
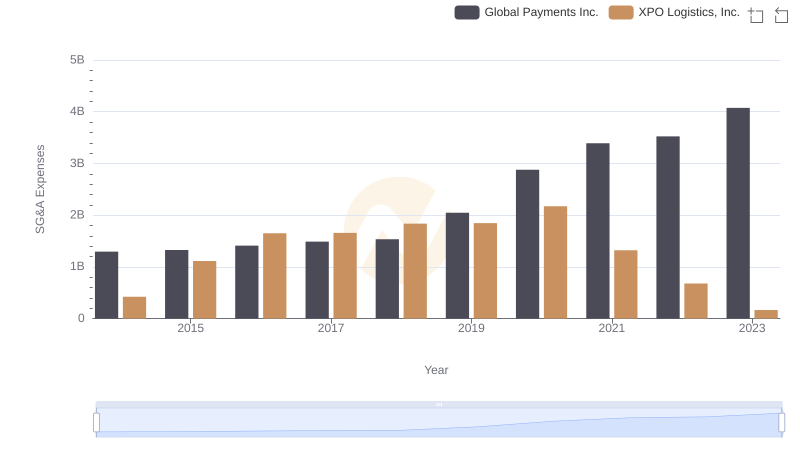
SG&A Efficiency Analysis: Comparing Global Payments Inc. and XPO Logistics, Inc.
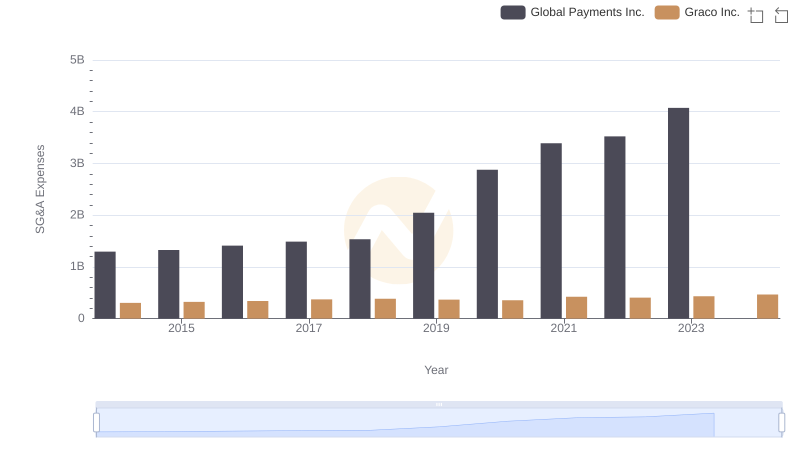
Global Payments Inc. vs Graco Inc.: SG&A Expense Trends
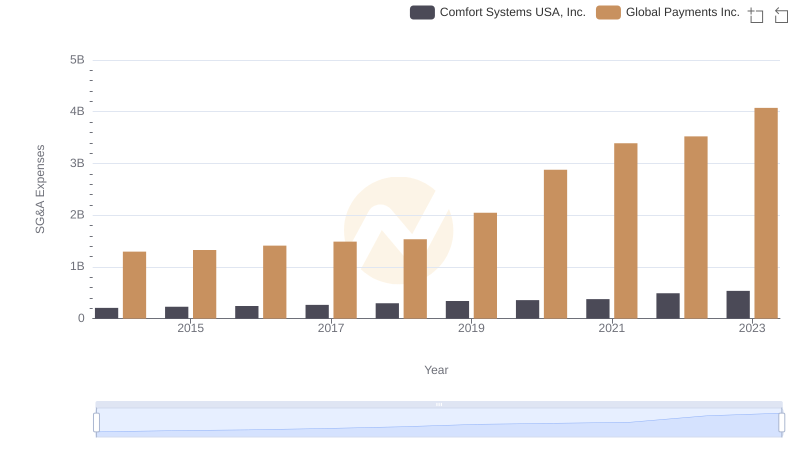
Selling, General, and Administrative Costs: Global Payments Inc. vs Comfort Systems USA, Inc.
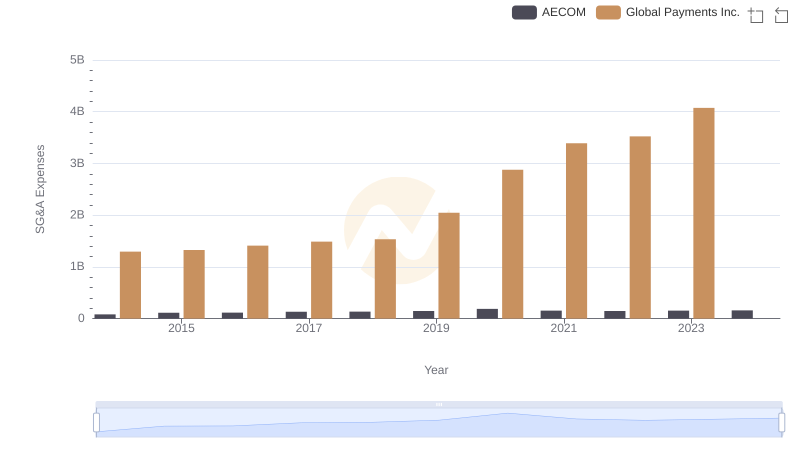
Global Payments Inc. and AECOM: SG&A Spending Patterns Compared
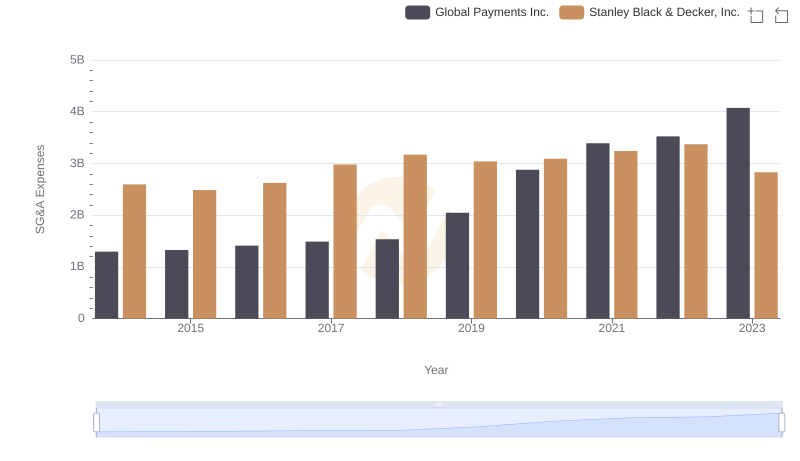
Breaking Down SG&A Expenses: Global Payments Inc. vs Stanley Black & Decker, Inc.
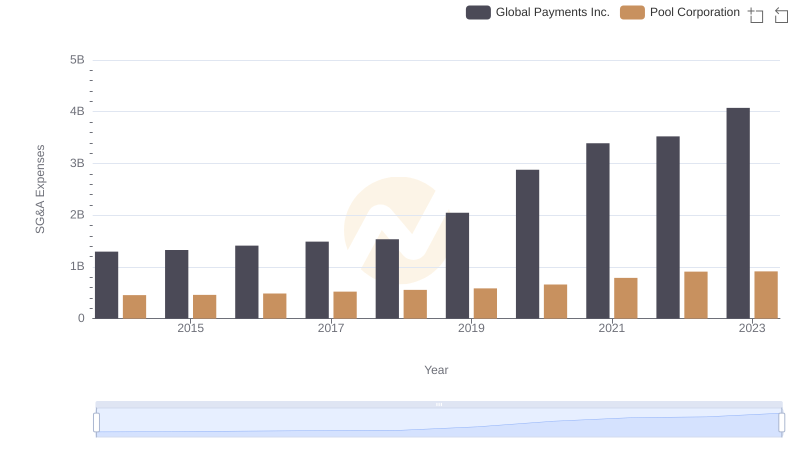
Comparing SG&A Expenses: Global Payments Inc. vs Pool Corporation Trends and Insights
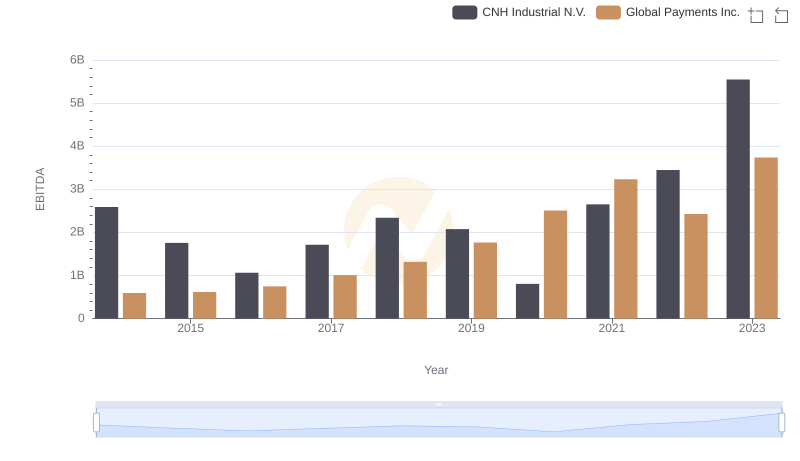
A Side-by-Side Analysis of EBITDA: Global Payments Inc. and CNH Industrial N.V.
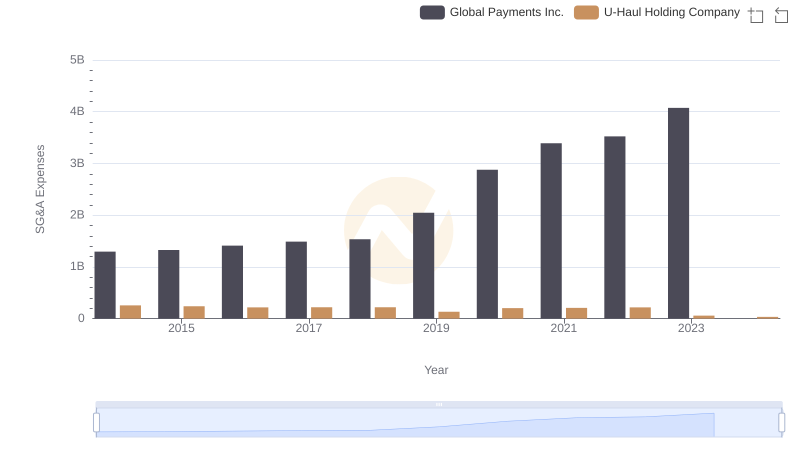
Cost Management Insights: SG&A Expenses for Global Payments Inc. and U-Haul Holding Company