| __timestamp | CNH Industrial N.V. | Global Payments Inc. |
|---|---|---|
| Wednesday, January 1, 2014 | 2591000000 | 594102000 |
| Thursday, January 1, 2015 | 1757000000 | 618109000 |
| Friday, January 1, 2016 | 1063000000 | 748136000 |
| Sunday, January 1, 2017 | 1715000000 | 1010019000 |
| Monday, January 1, 2018 | 2339000000 | 1315968000 |
| Tuesday, January 1, 2019 | 2077000000 | 1764994000 |
| Wednesday, January 1, 2020 | 807000000 | 2508393000 |
| Friday, January 1, 2021 | 2650000000 | 3233589000 |
| Saturday, January 1, 2022 | 3447000000 | 2427684000 |
| Sunday, January 1, 2023 | 5549000000 | 3606789000 |
| Monday, January 1, 2024 | 2333605000 |
Unleashing insights
In the ever-evolving landscape of global finance, understanding the financial health of industry giants is crucial. This analysis delves into the EBITDA performance of Global Payments Inc. and CNH Industrial N.V. from 2014 to 2023. Over this period, CNH Industrial N.V. demonstrated a remarkable growth trajectory, with its EBITDA surging by approximately 114%, peaking in 2023. In contrast, Global Payments Inc. experienced a steady climb, with a notable 530% increase in EBITDA, reflecting its strategic expansions and acquisitions.
The year 2020 marked a pivotal point for both companies. While CNH Industrial N.V. faced a dip, Global Payments Inc. capitalized on digital payment trends, achieving a 42% increase from the previous year. By 2023, Global Payments Inc. had outpaced its competitor, showcasing the dynamic shifts in the financial sector. This side-by-side analysis offers a compelling glimpse into the strategic maneuvers of these financial powerhouses.
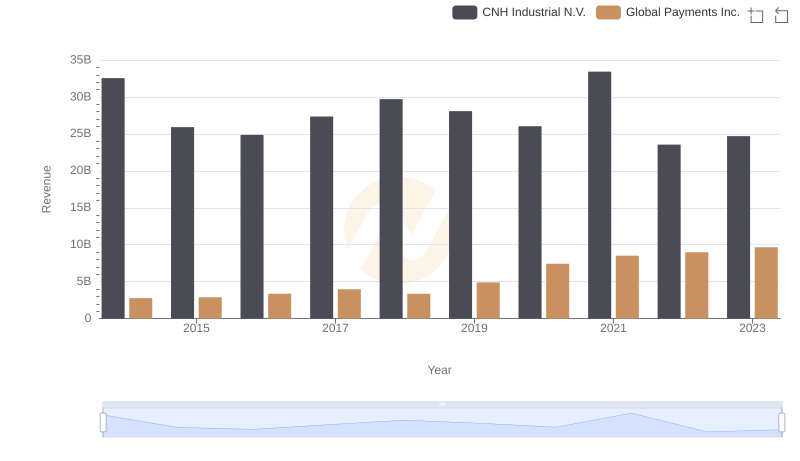
Revenue Insights: Global Payments Inc. and CNH Industrial N.V. Performance Compared
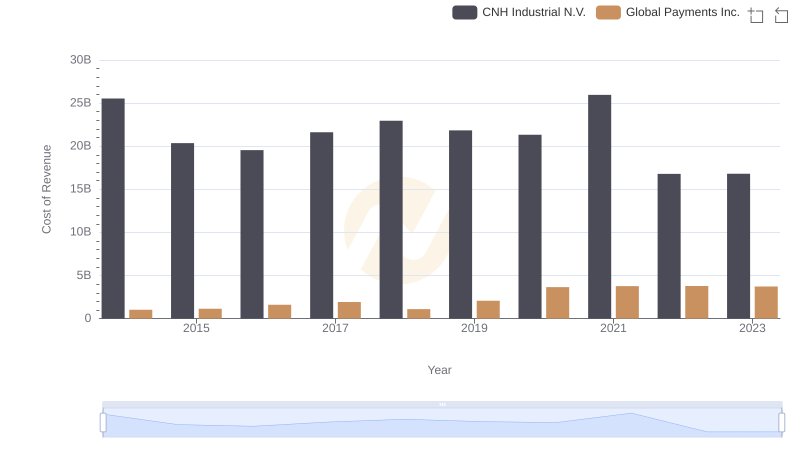
Cost of Revenue Comparison: Global Payments Inc. vs CNH Industrial N.V.
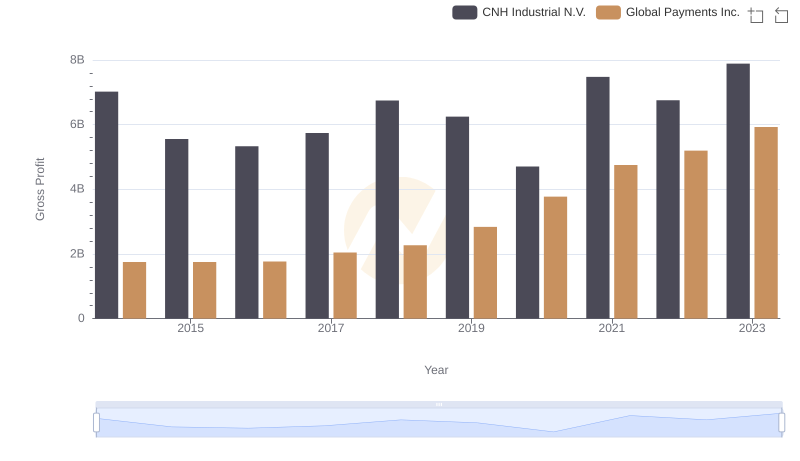
Key Insights on Gross Profit: Global Payments Inc. vs CNH Industrial N.V.
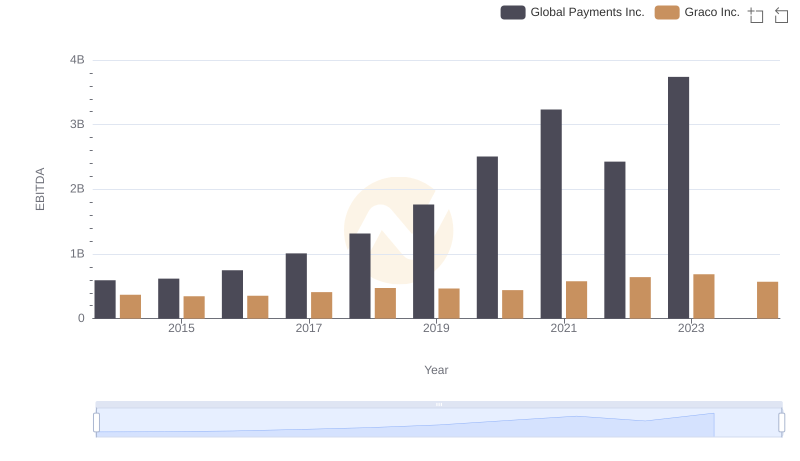
A Side-by-Side Analysis of EBITDA: Global Payments Inc. and Graco Inc.
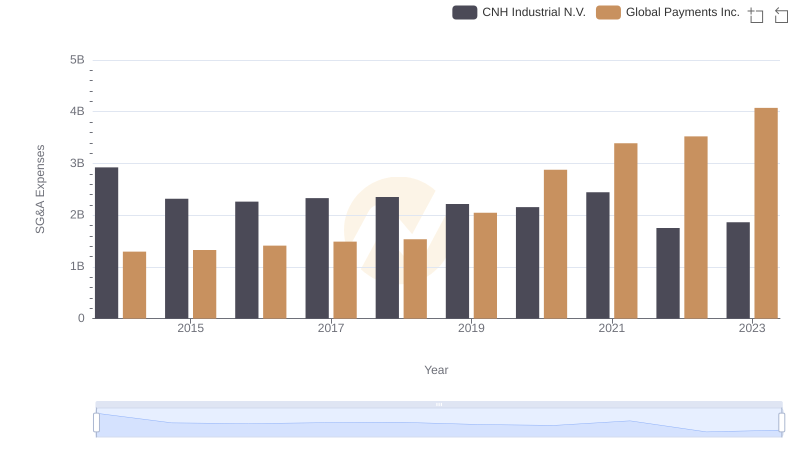
Global Payments Inc. or CNH Industrial N.V.: Who Manages SG&A Costs Better?

Comprehensive EBITDA Comparison: Global Payments Inc. vs XPO Logistics, Inc.
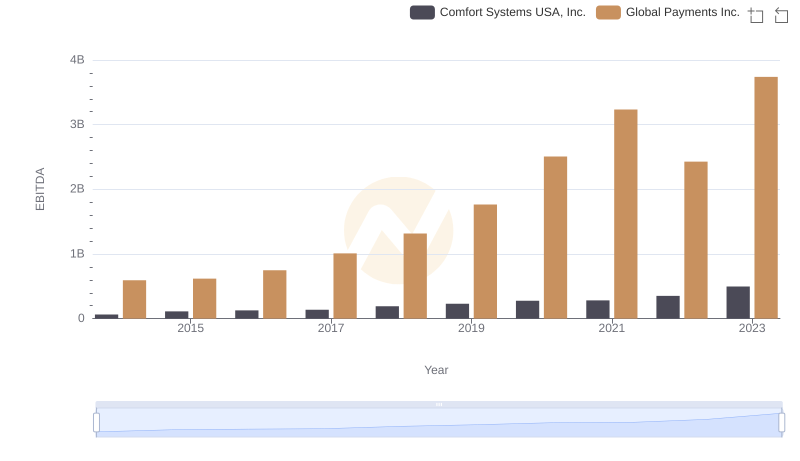
A Side-by-Side Analysis of EBITDA: Global Payments Inc. and Comfort Systems USA, Inc.
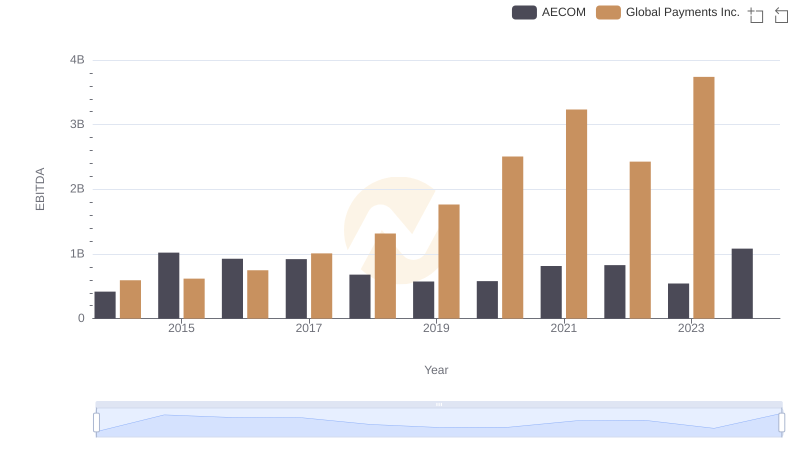
A Professional Review of EBITDA: Global Payments Inc. Compared to AECOM
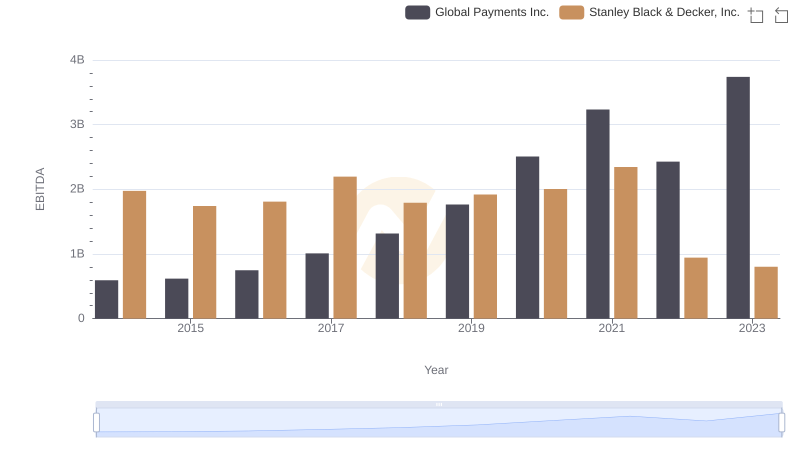
Comprehensive EBITDA Comparison: Global Payments Inc. vs Stanley Black & Decker, Inc.