| __timestamp | Global Payments Inc. | Pool Corporation |
|---|---|---|
| Wednesday, January 1, 2014 | 1295014000 | 454470000 |
| Thursday, January 1, 2015 | 1325567000 | 459422000 |
| Friday, January 1, 2016 | 1411096000 | 485228000 |
| Sunday, January 1, 2017 | 1488258000 | 520918000 |
| Monday, January 1, 2018 | 1534297000 | 556284000 |
| Tuesday, January 1, 2019 | 2046672000 | 583679000 |
| Wednesday, January 1, 2020 | 2878878000 | 659931000 |
| Friday, January 1, 2021 | 3391161000 | 786808000 |
| Saturday, January 1, 2022 | 3524578000 | 907629000 |
| Sunday, January 1, 2023 | 4073768000 | 912927000 |
| Monday, January 1, 2024 | 4285307000 |
Cracking the code
In the past decade, the Selling, General, and Administrative (SG&A) expenses of Global Payments Inc. and Pool Corporation have shown significant trends. Global Payments Inc. has seen a remarkable increase of over 200% in SG&A expenses from 2014 to 2023, reflecting its aggressive expansion and operational scaling. In contrast, Pool Corporation's SG&A expenses have grown by approximately 100% during the same period, indicating steady growth in its market operations.
These trends underscore the differing growth strategies and market dynamics faced by these two industry leaders.
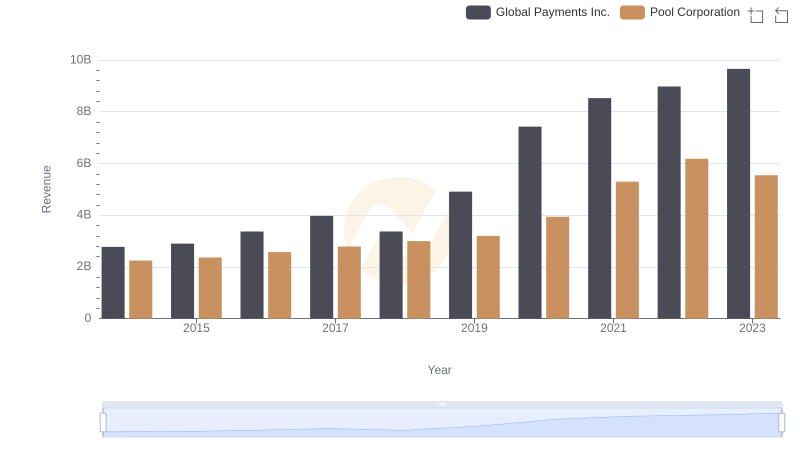
Revenue Showdown: Global Payments Inc. vs Pool Corporation
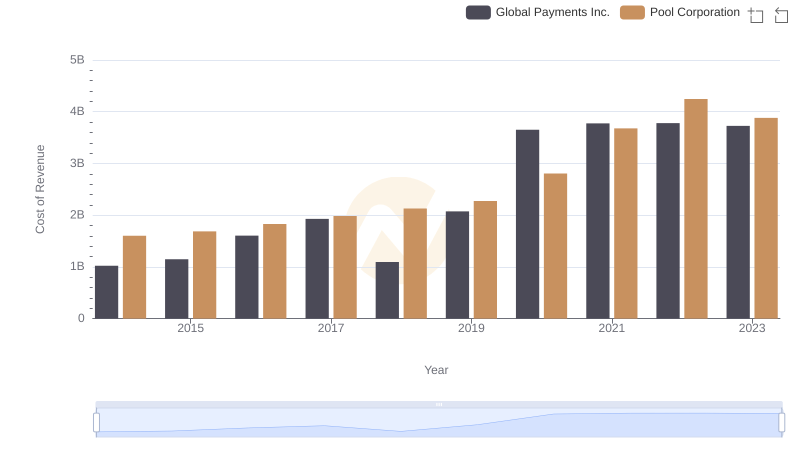
Global Payments Inc. vs Pool Corporation: Efficiency in Cost of Revenue Explored
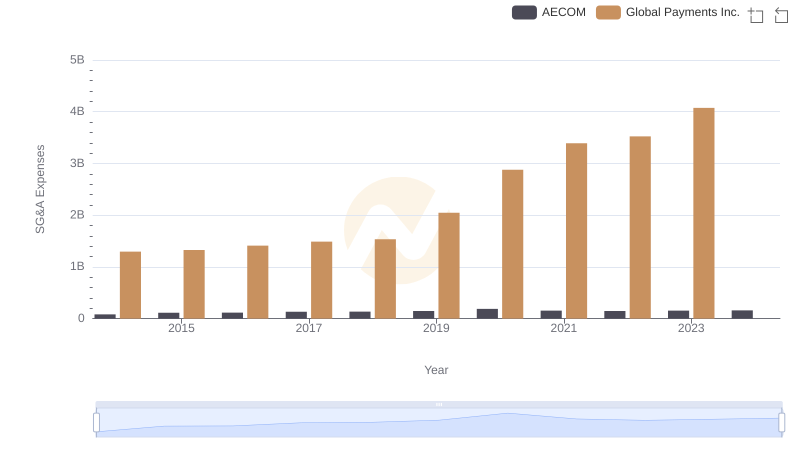
Global Payments Inc. and AECOM: SG&A Spending Patterns Compared

Key Insights on Gross Profit: Global Payments Inc. vs Pool Corporation
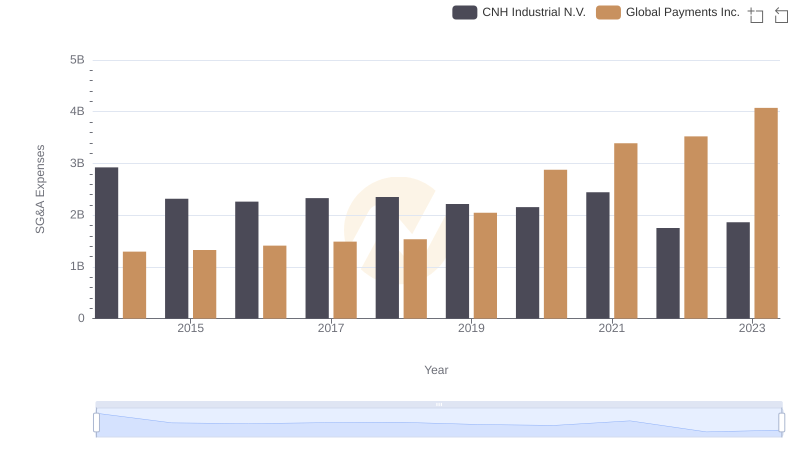
Global Payments Inc. or CNH Industrial N.V.: Who Manages SG&A Costs Better?
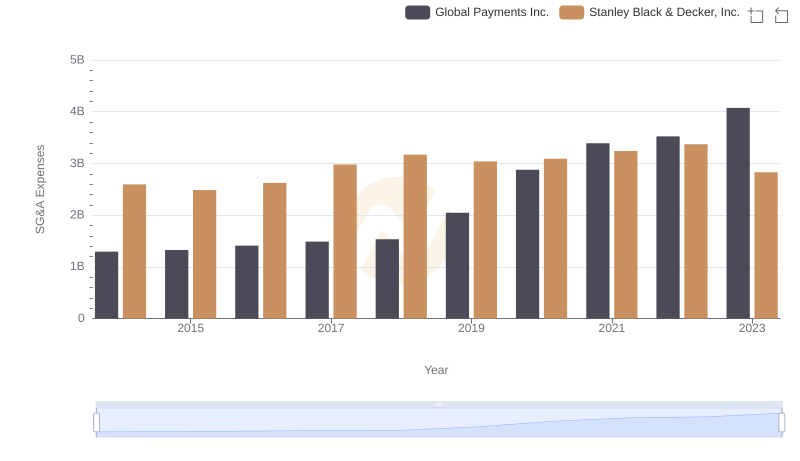
Breaking Down SG&A Expenses: Global Payments Inc. vs Stanley Black & Decker, Inc.
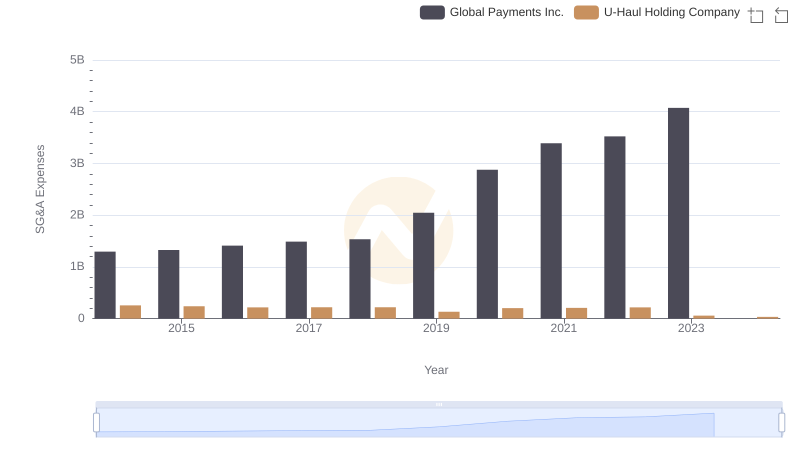
Cost Management Insights: SG&A Expenses for Global Payments Inc. and U-Haul Holding Company
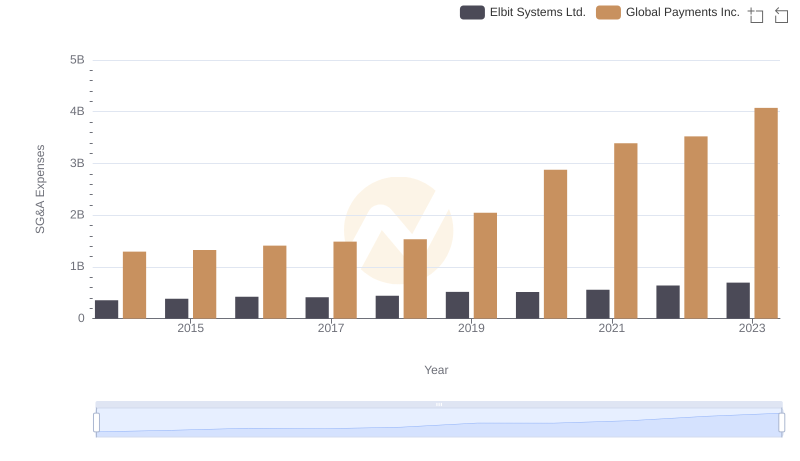
Global Payments Inc. or Elbit Systems Ltd.: Who Manages SG&A Costs Better?
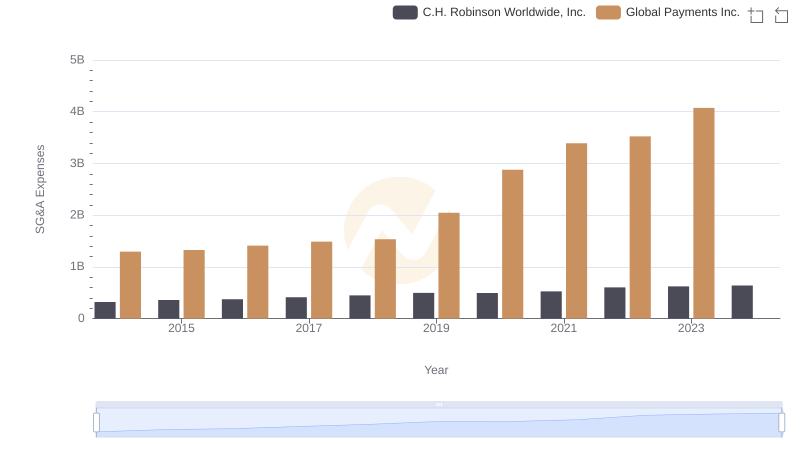
Who Optimizes SG&A Costs Better? Global Payments Inc. or C.H. Robinson Worldwide, Inc.