| __timestamp | AerCap Holdings N.V. | Global Payments Inc. |
|---|---|---|
| Wednesday, January 1, 2014 | 299900000 | 1295014000 |
| Thursday, January 1, 2015 | 381308000 | 1325567000 |
| Friday, January 1, 2016 | 351012000 | 1411096000 |
| Sunday, January 1, 2017 | 348291000 | 1488258000 |
| Monday, January 1, 2018 | 305226000 | 1534297000 |
| Tuesday, January 1, 2019 | 267458000 | 2046672000 |
| Wednesday, January 1, 2020 | 242161000 | 2878878000 |
| Friday, January 1, 2021 | 317888000 | 3391161000 |
| Saturday, January 1, 2022 | 399530000 | 3524578000 |
| Sunday, January 1, 2023 | 464128000 | 4073768000 |
| Monday, January 1, 2024 | 4285307000 |
Unlocking the unknown
In the ever-evolving landscape of corporate finance, managing Selling, General, and Administrative (SG&A) expenses is crucial for maintaining profitability. This analysis delves into the SG&A expenses of two industry giants: Global Payments Inc. and AerCap Holdings N.V., from 2014 to 2023. Over this period, Global Payments Inc. has seen a staggering 214% increase in SG&A expenses, peaking at approximately $4.1 billion in 2023. In contrast, AerCap Holdings N.V. experienced a more modest 55% rise, reaching around $464 million in the same year. This disparity highlights differing strategic approaches to cost management. While Global Payments Inc. has expanded its operational footprint, AerCap Holdings N.V. has maintained a more conservative growth trajectory. Understanding these trends offers valuable insights into how companies navigate financial challenges and opportunities in a dynamic market.
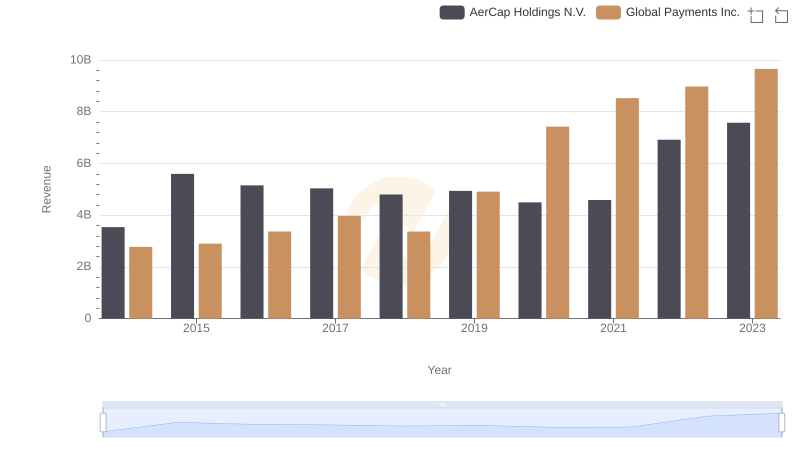
Global Payments Inc. vs AerCap Holdings N.V.: Examining Key Revenue Metrics
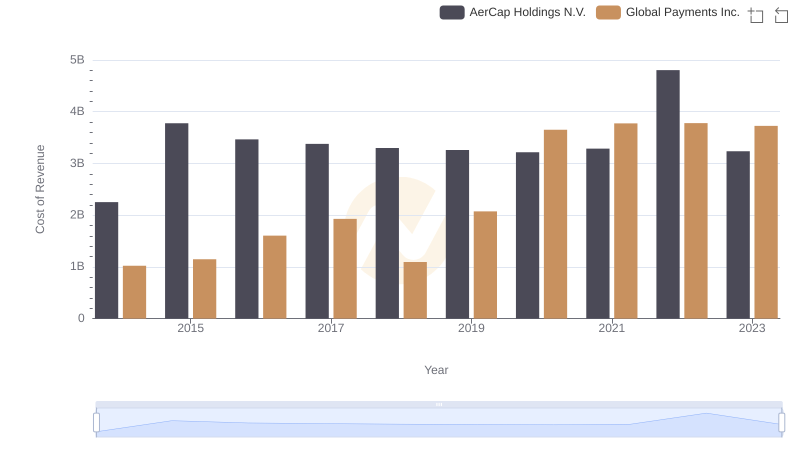
Cost of Revenue: Key Insights for Global Payments Inc. and AerCap Holdings N.V.
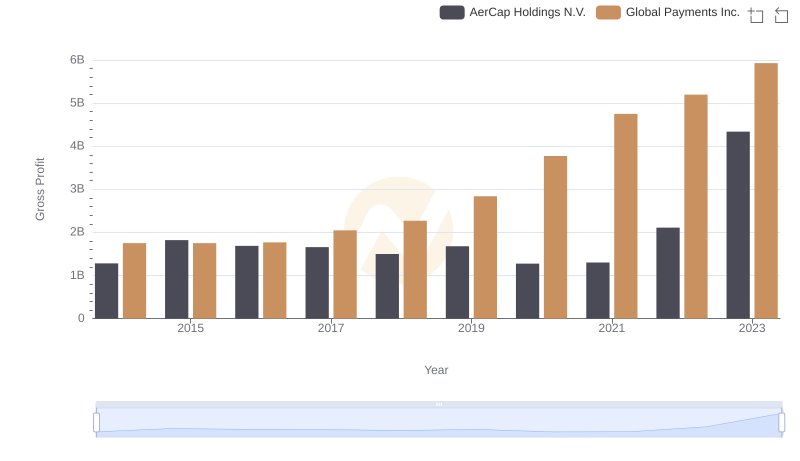
Gross Profit Comparison: Global Payments Inc. and AerCap Holdings N.V. Trends
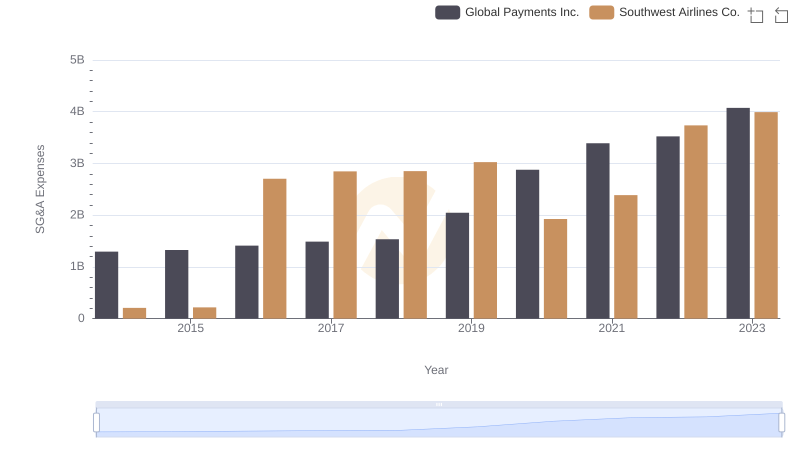
Comparing SG&A Expenses: Global Payments Inc. vs Southwest Airlines Co. Trends and Insights
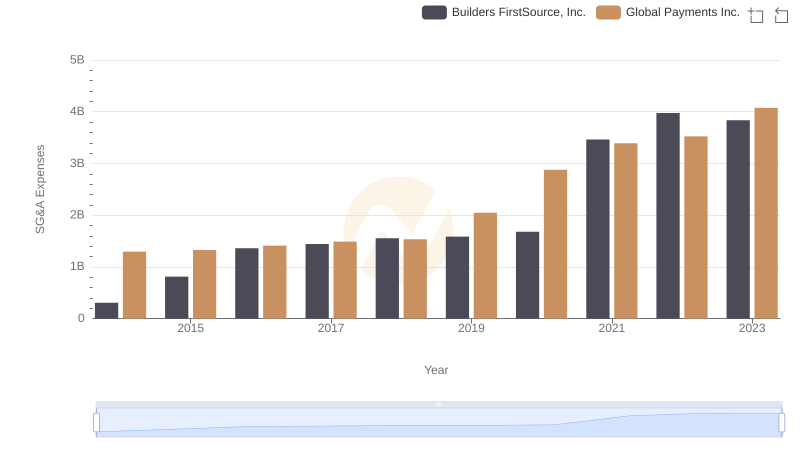
Cost Management Insights: SG&A Expenses for Global Payments Inc. and Builders FirstSource, Inc.
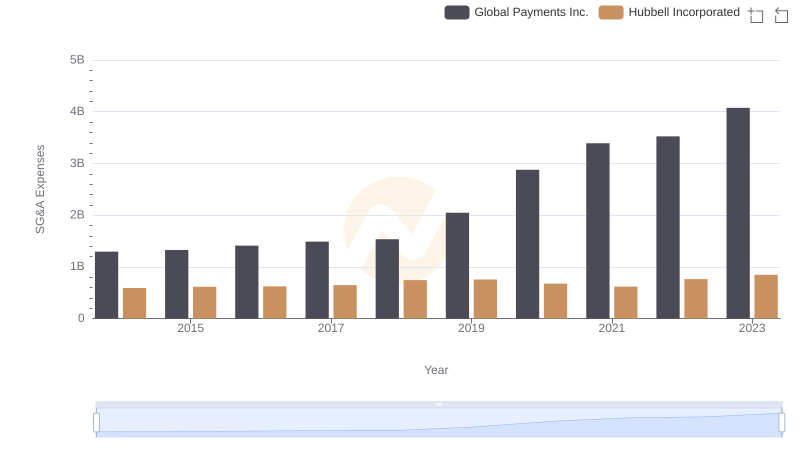
Comparing SG&A Expenses: Global Payments Inc. vs Hubbell Incorporated Trends and Insights
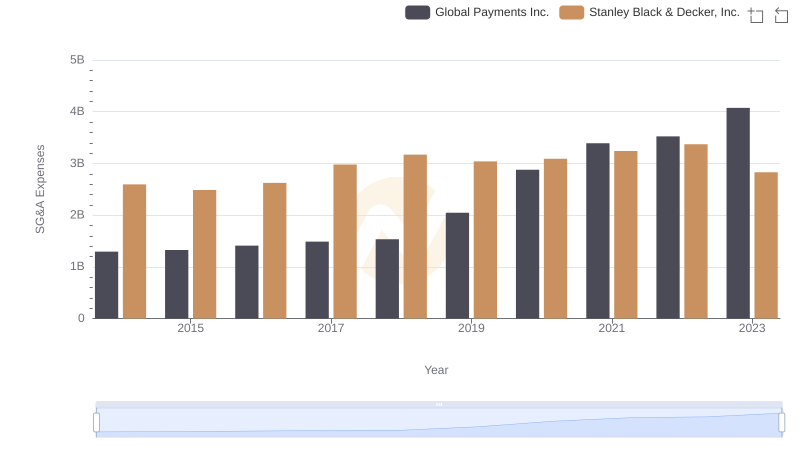
Breaking Down SG&A Expenses: Global Payments Inc. vs Stanley Black & Decker, Inc.
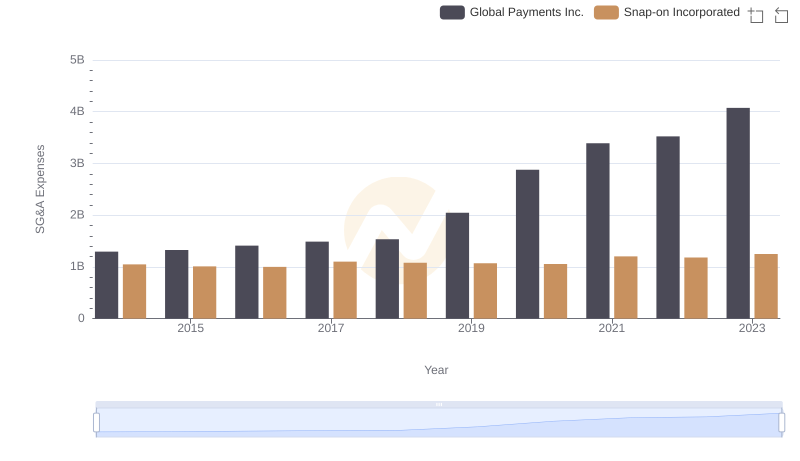
Operational Costs Compared: SG&A Analysis of Global Payments Inc. and Snap-on Incorporated
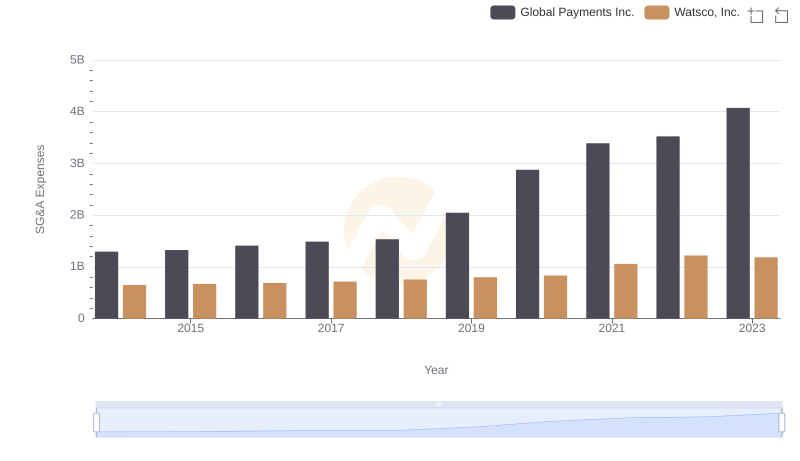
Global Payments Inc. vs Watsco, Inc.: SG&A Expense Trends
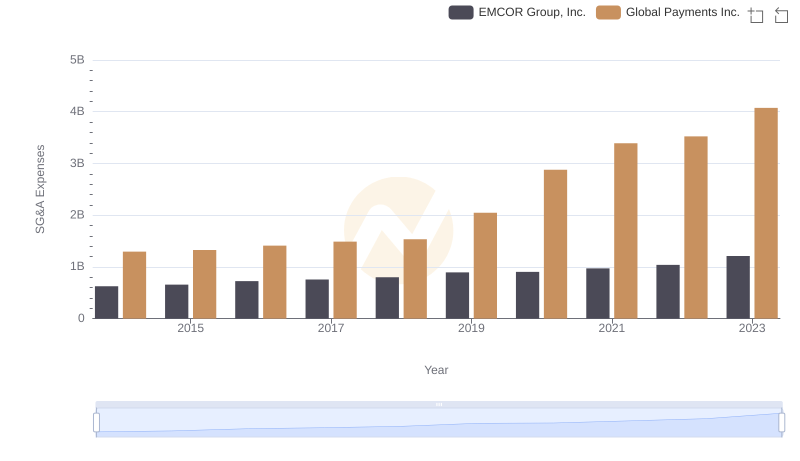
Comparing SG&A Expenses: Global Payments Inc. vs EMCOR Group, Inc. Trends and Insights
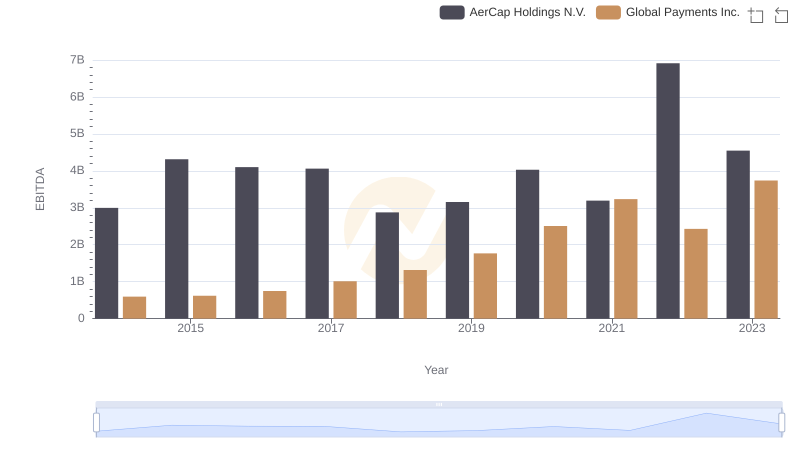
Global Payments Inc. and AerCap Holdings N.V.: A Detailed Examination of EBITDA Performance
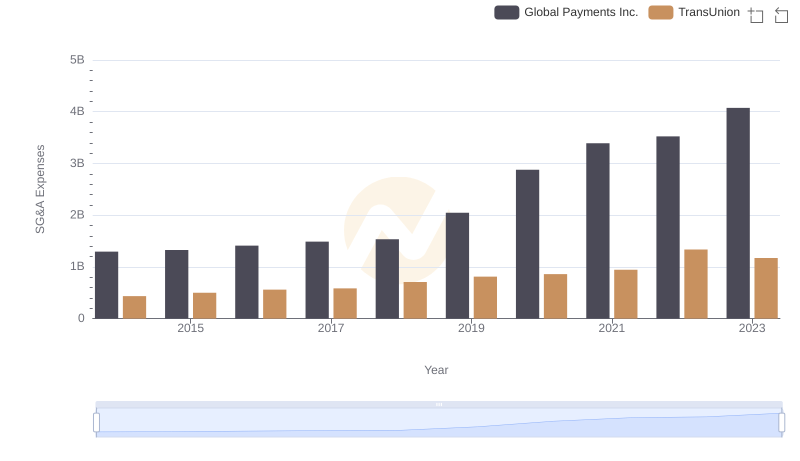
Selling, General, and Administrative Costs: Global Payments Inc. vs TransUnion