| __timestamp | Equifax Inc. | Ferrovial SE |
|---|---|---|
| Wednesday, January 1, 2014 | 844700000 | 1131000000 |
| Thursday, January 1, 2015 | 887400000 | 1143000000 |
| Friday, January 1, 2016 | 1113400000 | 1267000000 |
| Sunday, January 1, 2017 | 1210700000 | 1345000000 |
| Monday, January 1, 2018 | 1440400000 | 985000000 |
| Tuesday, January 1, 2019 | 1521700000 | 949000000 |
| Wednesday, January 1, 2020 | 1737400000 | 1005000000 |
| Friday, January 1, 2021 | 1980900000 | 1077000000 |
| Saturday, January 1, 2022 | 2177200000 | 1197000000 |
| Sunday, January 1, 2023 | 2335100000 | 1129000000 |
| Monday, January 1, 2024 | 0 |
Unleashing the power of data
In the ever-evolving landscape of global business, understanding cost efficiency is paramount. This analysis delves into the cost of revenue trends for Equifax Inc. and Ferrovial SE from 2014 to 2023. Over this period, Equifax Inc. demonstrated a robust growth trajectory, with its cost of revenue increasing by approximately 176%, from $844.7 million in 2014 to $2.335 billion in 2023. This reflects a strategic expansion and investment in operational capabilities.
Conversely, Ferrovial SE experienced a more modest fluctuation, with its cost of revenue peaking in 2017 at $1.345 billion before stabilizing around $1.129 billion in 2023. This suggests a focus on maintaining operational efficiency amidst market challenges. The contrasting trends highlight Equifax's aggressive growth strategy compared to Ferrovial's steady approach, offering valuable insights into their respective market strategies.
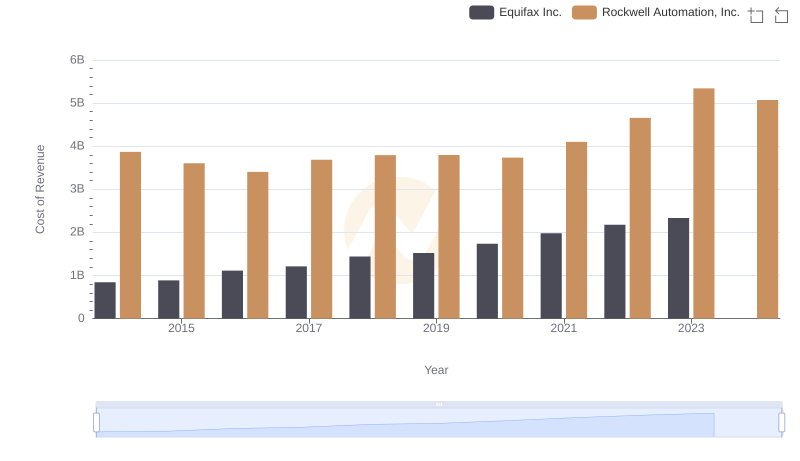
Cost of Revenue Comparison: Equifax Inc. vs Rockwell Automation, Inc.
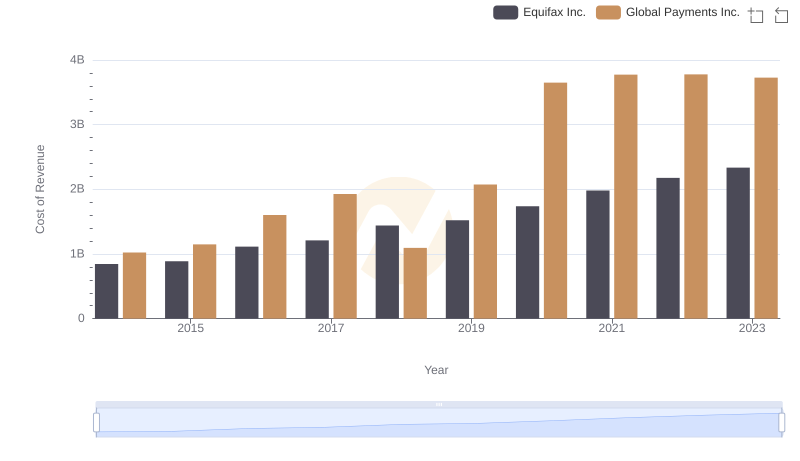
Comparing Cost of Revenue Efficiency: Equifax Inc. vs Global Payments Inc.
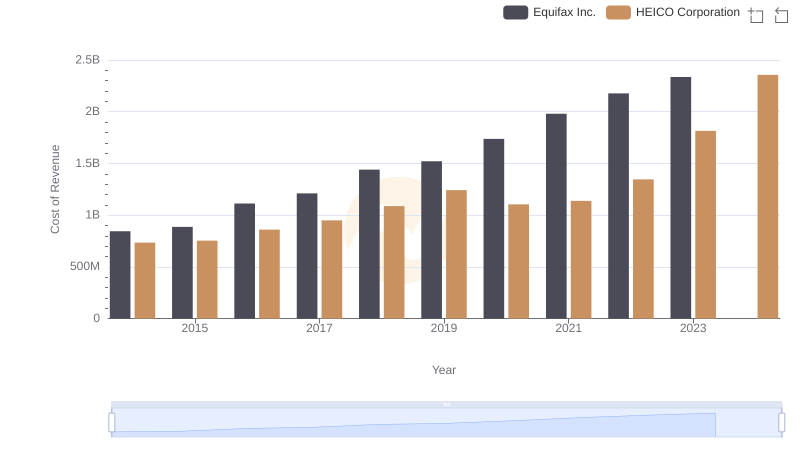
Equifax Inc. vs HEICO Corporation: Efficiency in Cost of Revenue Explored
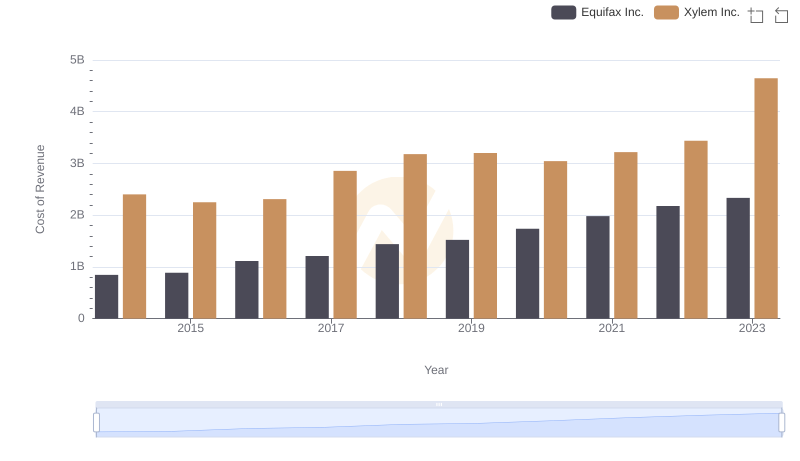
Analyzing Cost of Revenue: Equifax Inc. and Xylem Inc.
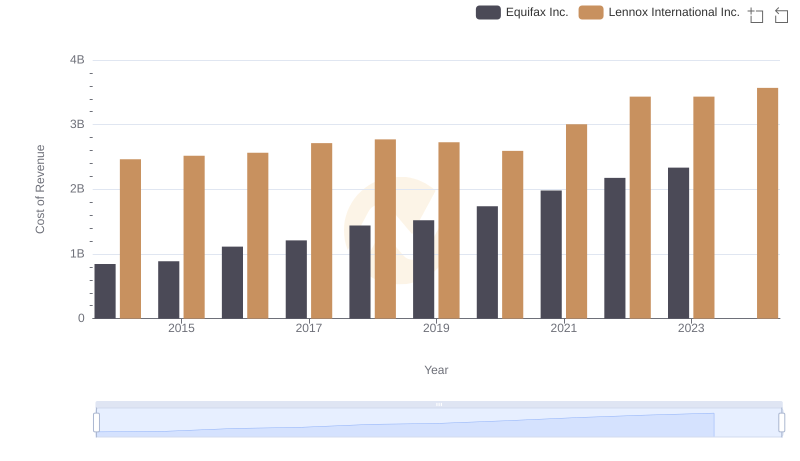
Cost of Revenue Comparison: Equifax Inc. vs Lennox International Inc.
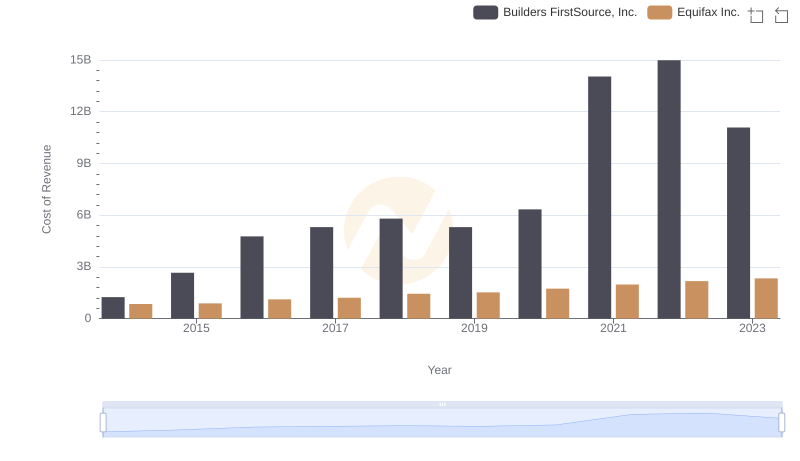
Cost Insights: Breaking Down Equifax Inc. and Builders FirstSource, Inc.'s Expenses
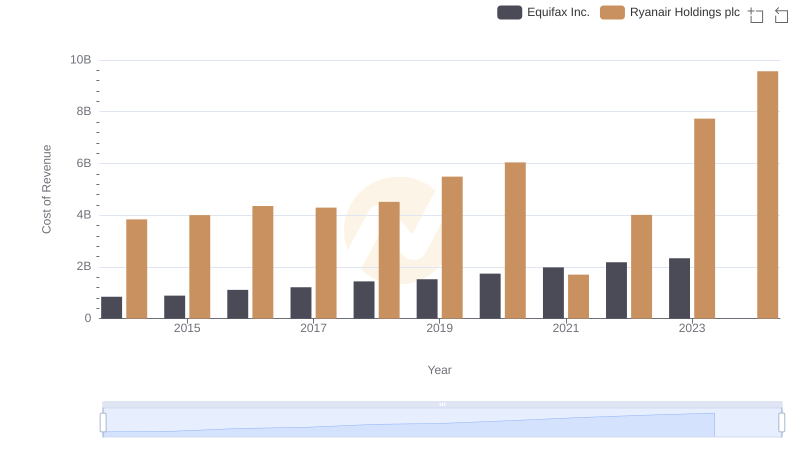
Equifax Inc. vs Ryanair Holdings plc: Efficiency in Cost of Revenue Explored
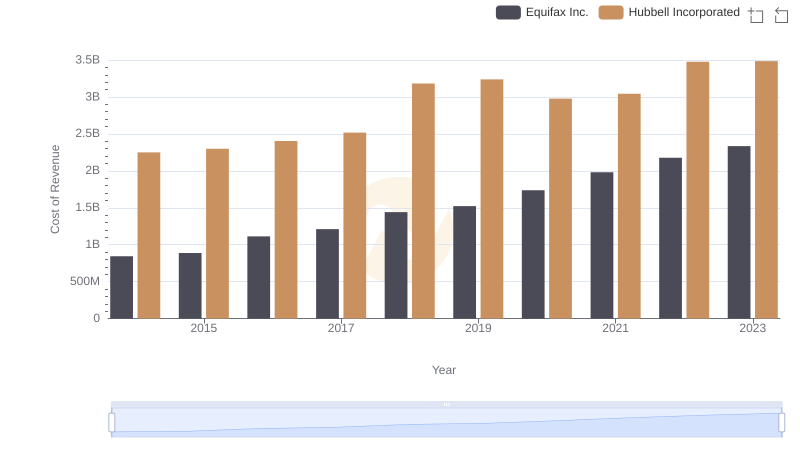
Cost Insights: Breaking Down Equifax Inc. and Hubbell Incorporated's Expenses
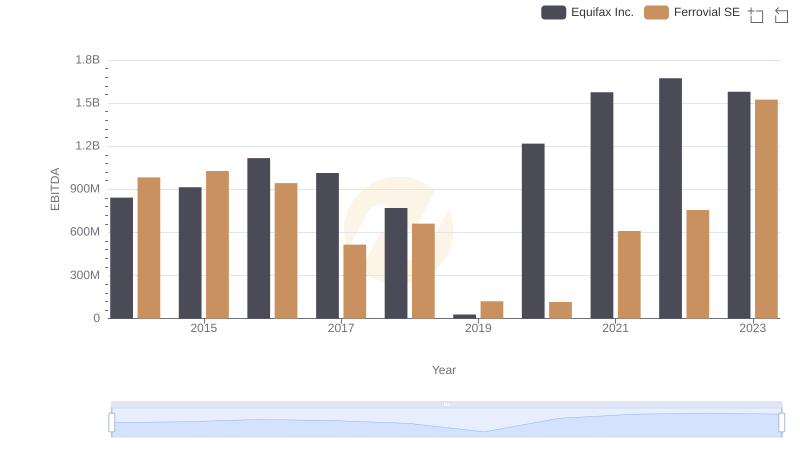
Comprehensive EBITDA Comparison: Equifax Inc. vs Ferrovial SE