| __timestamp | Equifax Inc. | Hubbell Incorporated |
|---|---|---|
| Wednesday, January 1, 2014 | 844700000 | 2250400000 |
| Thursday, January 1, 2015 | 887400000 | 2298600000 |
| Friday, January 1, 2016 | 1113400000 | 2404500000 |
| Sunday, January 1, 2017 | 1210700000 | 2516900000 |
| Monday, January 1, 2018 | 1440400000 | 3181300000 |
| Tuesday, January 1, 2019 | 1521700000 | 3238300000 |
| Wednesday, January 1, 2020 | 1737400000 | 2976700000 |
| Friday, January 1, 2021 | 1980900000 | 3042600000 |
| Saturday, January 1, 2022 | 2177200000 | 3476300000 |
| Sunday, January 1, 2023 | 2335100000 | 3484800000 |
| Monday, January 1, 2024 | 0 | 3724400000 |
Unveiling the hidden dimensions of data
In the ever-evolving landscape of corporate finance, understanding cost structures is pivotal. This analysis delves into the cost of revenue trends for Equifax Inc. and Hubbell Incorporated from 2014 to 2023. Over this decade, Equifax's cost of revenue surged by approximately 176%, starting from $844 million in 2014 to $2.34 billion in 2023. Meanwhile, Hubbell Incorporated experienced a 55% increase, with costs rising from $2.25 billion to $3.48 billion.
These insights underscore the dynamic nature of cost management in diverse industries, offering a window into strategic financial planning.
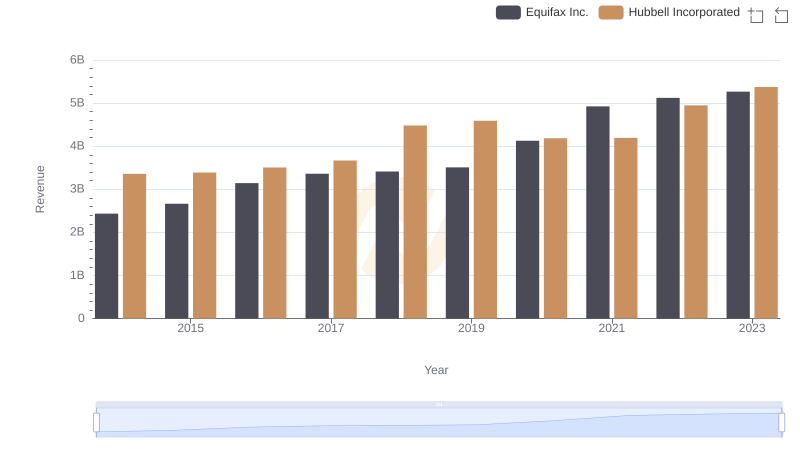
Breaking Down Revenue Trends: Equifax Inc. vs Hubbell Incorporated
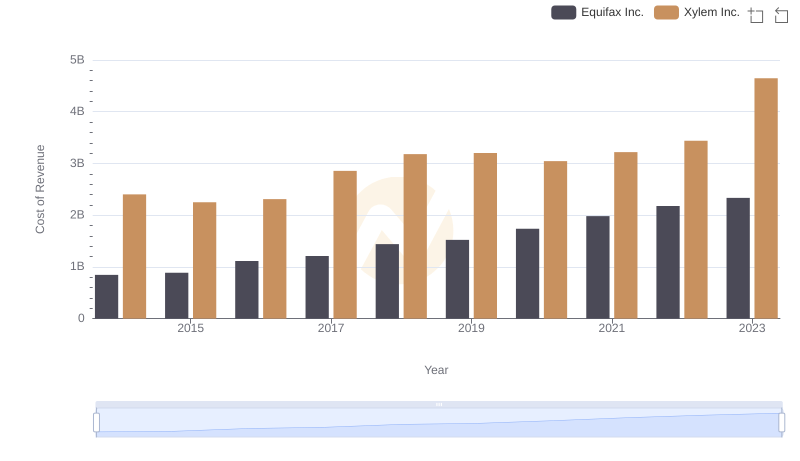
Analyzing Cost of Revenue: Equifax Inc. and Xylem Inc.
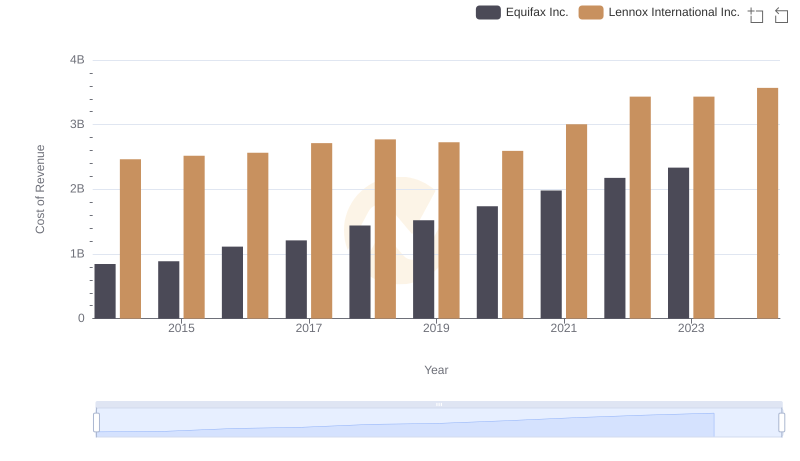
Cost of Revenue Comparison: Equifax Inc. vs Lennox International Inc.
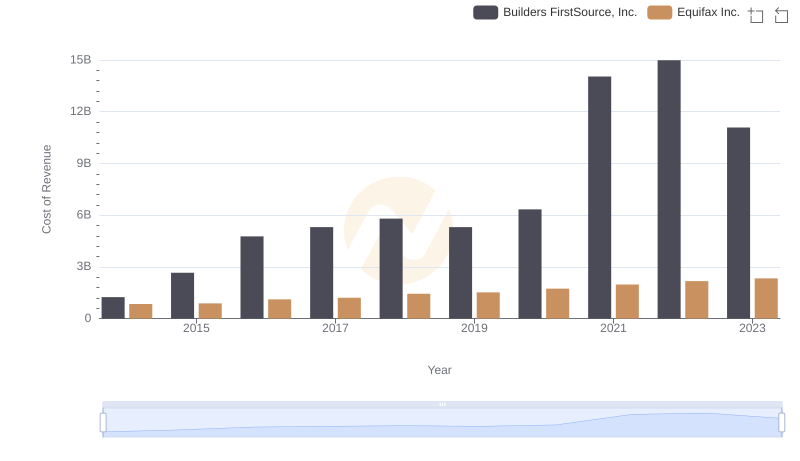
Cost Insights: Breaking Down Equifax Inc. and Builders FirstSource, Inc.'s Expenses
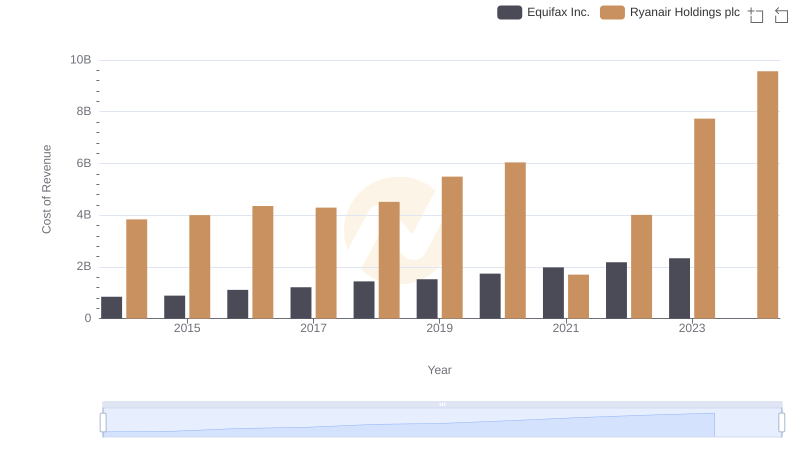
Equifax Inc. vs Ryanair Holdings plc: Efficiency in Cost of Revenue Explored
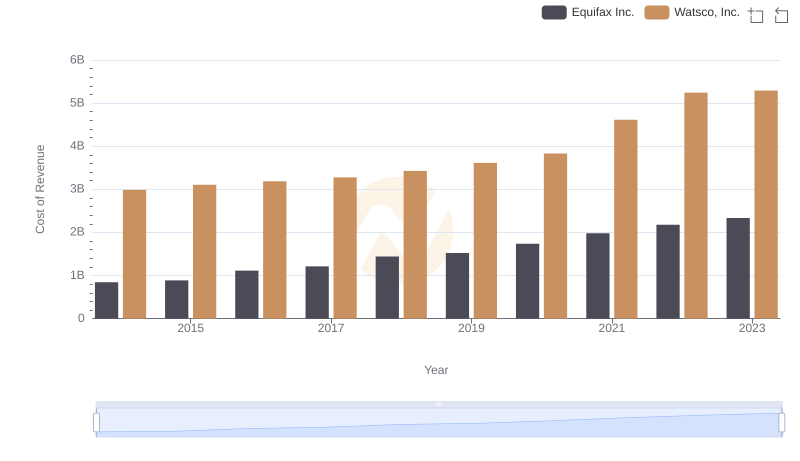
Cost of Revenue: Key Insights for Equifax Inc. and Watsco, Inc.
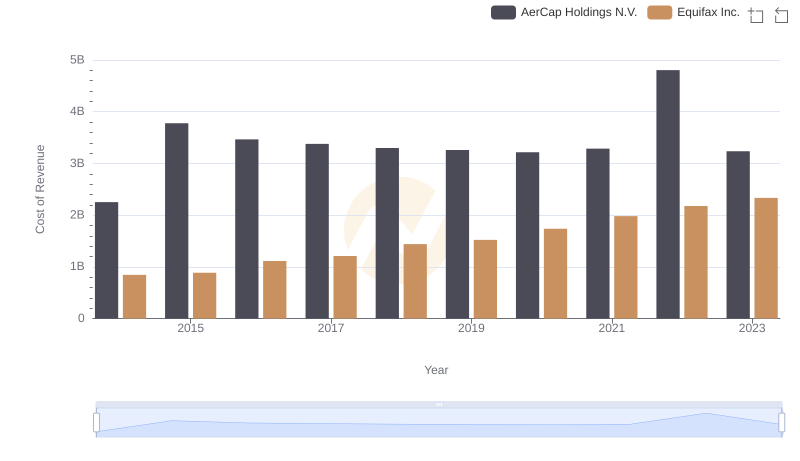
Analyzing Cost of Revenue: Equifax Inc. and AerCap Holdings N.V.
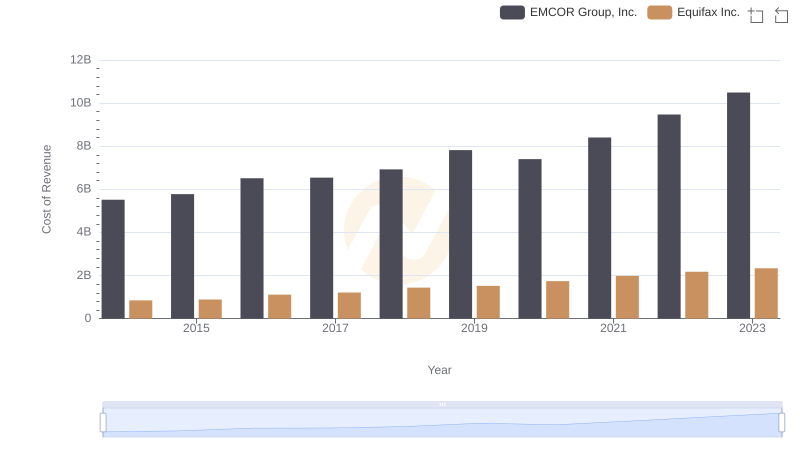
Equifax Inc. vs EMCOR Group, Inc.: Efficiency in Cost of Revenue Explored
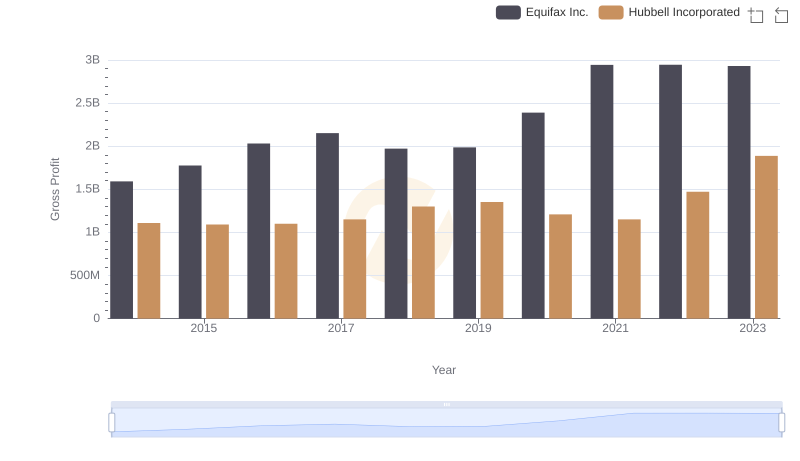
Equifax Inc. vs Hubbell Incorporated: A Gross Profit Performance Breakdown