| __timestamp | AECOM | Equifax Inc. |
|---|---|---|
| Wednesday, January 1, 2014 | 80908000 | 751700000 |
| Thursday, January 1, 2015 | 113975000 | 884300000 |
| Friday, January 1, 2016 | 115088000 | 948200000 |
| Sunday, January 1, 2017 | 133309000 | 1039100000 |
| Monday, January 1, 2018 | 135787000 | 1213300000 |
| Tuesday, January 1, 2019 | 148123000 | 1990200000 |
| Wednesday, January 1, 2020 | 188535000 | 1322500000 |
| Friday, January 1, 2021 | 155072000 | 1324600000 |
| Saturday, January 1, 2022 | 147309000 | 1328900000 |
| Sunday, January 1, 2023 | 153575000 | 1385700000 |
| Monday, January 1, 2024 | 160105000 | 1450500000 |
Unveiling the hidden dimensions of data
In the ever-evolving landscape of corporate finance, understanding the nuances of Selling, General, and Administrative (SG&A) expenses is crucial. Over the past decade, Equifax Inc. and AECOM have demonstrated distinct spending patterns. From 2014 to 2023, Equifax's SG&A expenses surged by approximately 84%, peaking in 2019. In contrast, AECOM's expenses grew by about 98% during the same period, with a notable increase in 2020. This divergence highlights Equifax's more consistent growth, while AECOM experienced fluctuations, particularly in 2020. Interestingly, Equifax's data for 2024 is missing, leaving room for speculation on future trends. These insights offer a window into the strategic priorities of these industry giants, reflecting their operational focus and market positioning. As businesses navigate economic uncertainties, analyzing such financial metrics becomes indispensable for stakeholders aiming to make informed decisions.
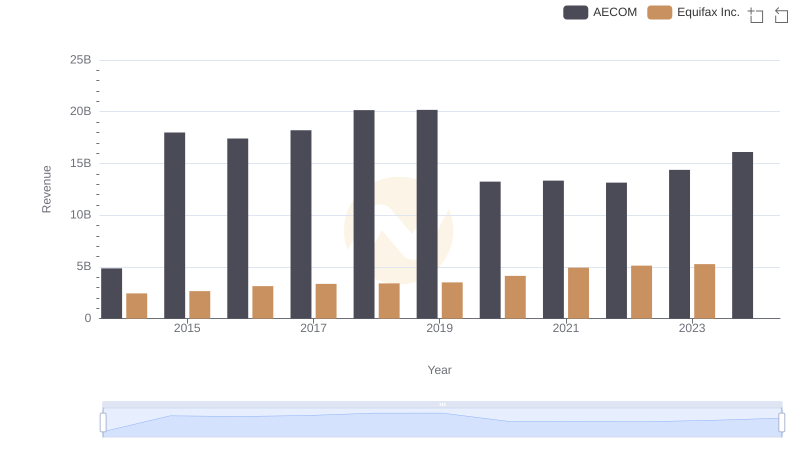
Breaking Down Revenue Trends: Equifax Inc. vs AECOM
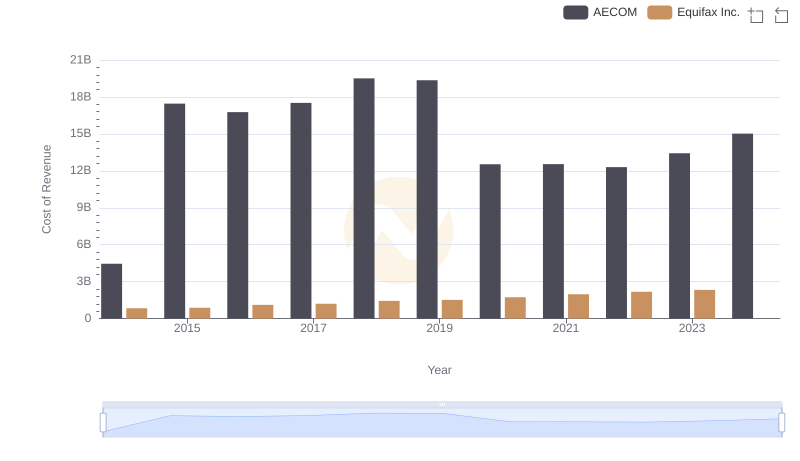
Equifax Inc. vs AECOM: Efficiency in Cost of Revenue Explored
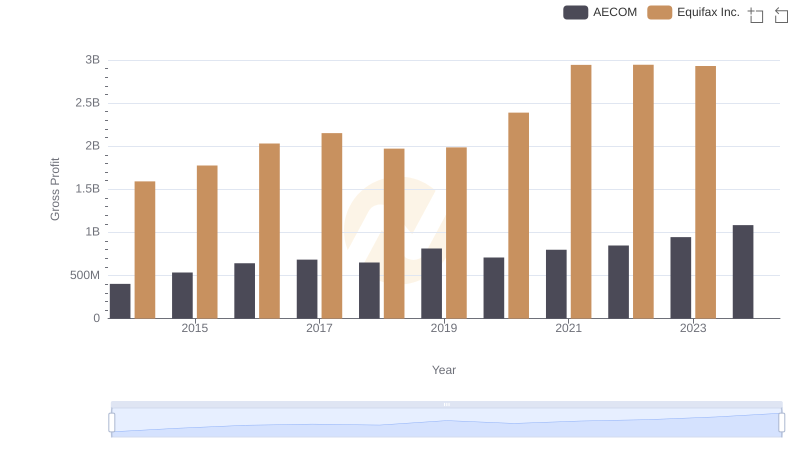
Who Generates Higher Gross Profit? Equifax Inc. or AECOM
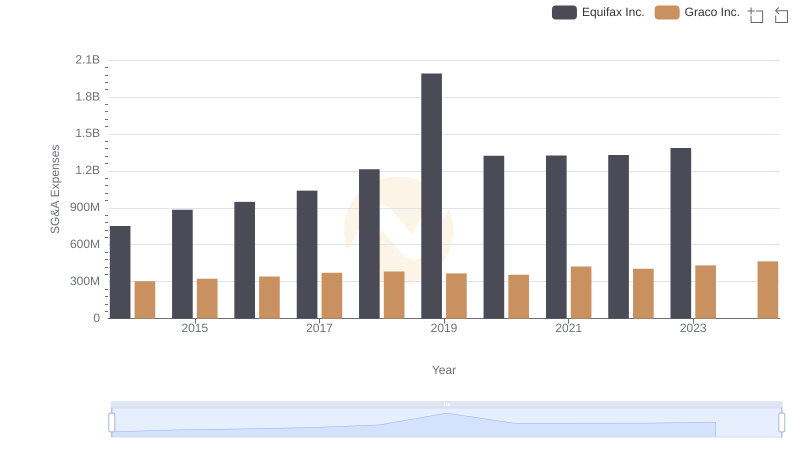
Who Optimizes SG&A Costs Better? Equifax Inc. or Graco Inc.
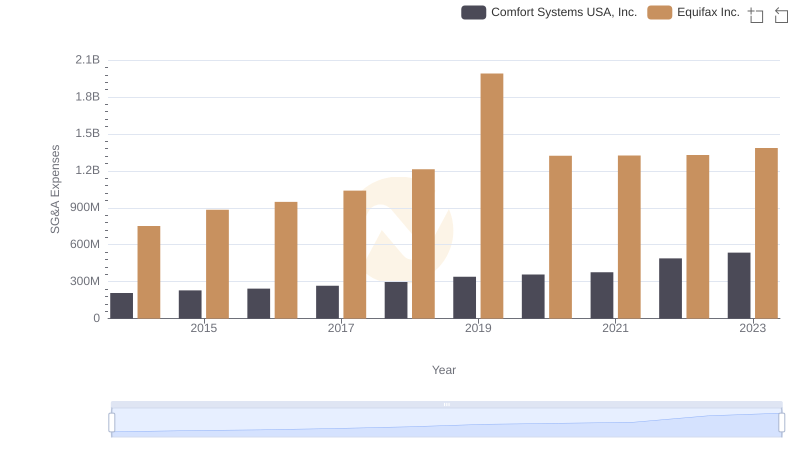
Equifax Inc. or Comfort Systems USA, Inc.: Who Manages SG&A Costs Better?
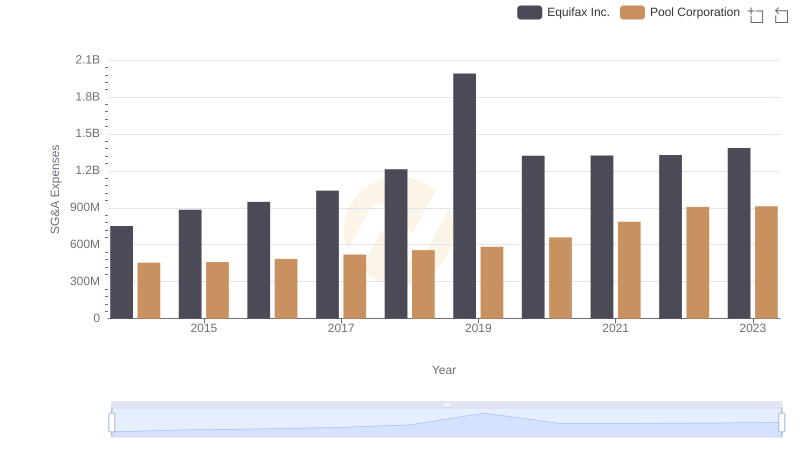
Comparing SG&A Expenses: Equifax Inc. vs Pool Corporation Trends and Insights
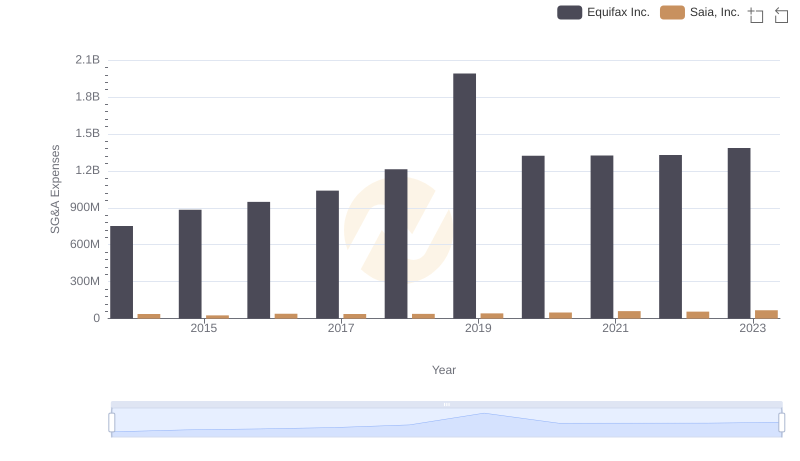
Operational Costs Compared: SG&A Analysis of Equifax Inc. and Saia, Inc.
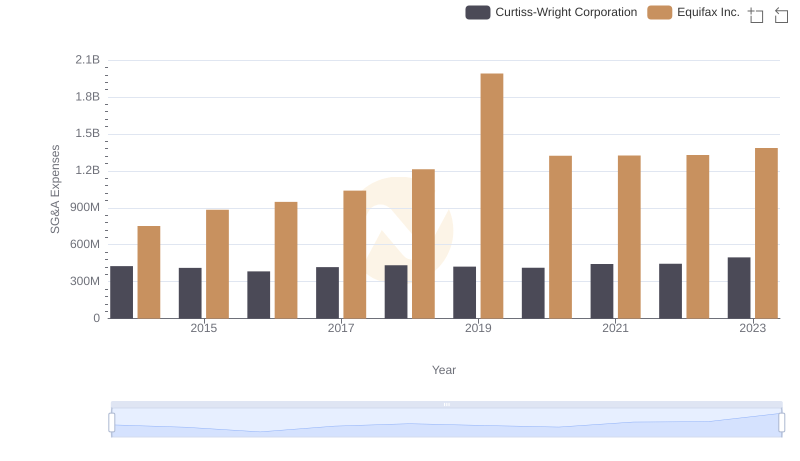
Equifax Inc. or Curtiss-Wright Corporation: Who Manages SG&A Costs Better?
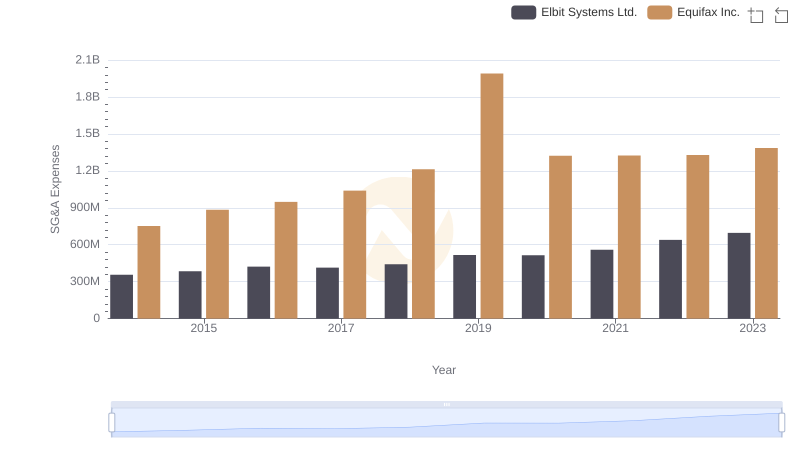
Operational Costs Compared: SG&A Analysis of Equifax Inc. and Elbit Systems Ltd.
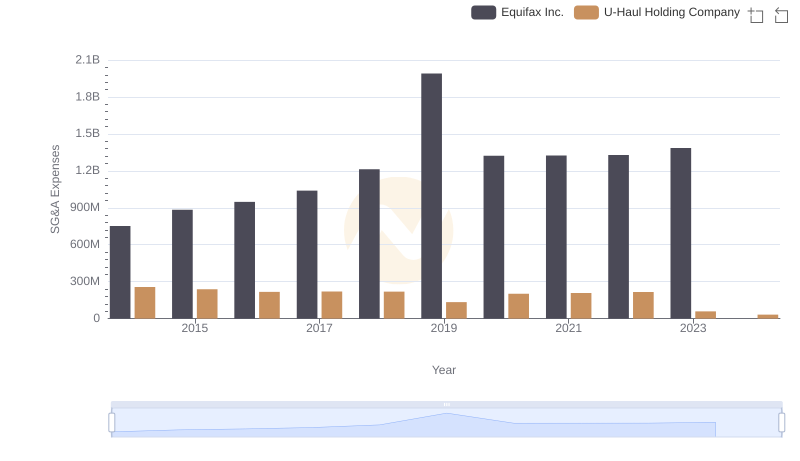
Selling, General, and Administrative Costs: Equifax Inc. vs U-Haul Holding Company