| __timestamp | AECOM | Equifax Inc. |
|---|---|---|
| Wednesday, January 1, 2014 | 4855627000 | 2436400000 |
| Thursday, January 1, 2015 | 17989880000 | 2663600000 |
| Friday, January 1, 2016 | 17410825000 | 3144900000 |
| Sunday, January 1, 2017 | 18203402000 | 3362200000 |
| Monday, January 1, 2018 | 20155512000 | 3412100000 |
| Tuesday, January 1, 2019 | 20173329000 | 3507600000 |
| Wednesday, January 1, 2020 | 13239976000 | 4127500000 |
| Friday, January 1, 2021 | 13340852000 | 4923900000 |
| Saturday, January 1, 2022 | 13148182000 | 5122200000 |
| Sunday, January 1, 2023 | 14378461000 | 5265200000 |
| Monday, January 1, 2024 | 16105498000 | 5681100000 |
Data in motion
In the ever-evolving landscape of the financial sector, understanding revenue trends is crucial. This analysis delves into the annual revenue trajectories of Equifax Inc. and AECOM from 2014 to 2023. AECOM, a global infrastructure firm, showcased a robust growth pattern, with revenues peaking in 2018 and 2019, reaching nearly 20 billion USD. However, a dip was observed in 2020, likely due to global economic disruptions, before rebounding by 2023. Equifax Inc., a leader in consumer credit reporting, demonstrated a steady upward trend, with revenues increasing by over 115% from 2014 to 2023. Notably, Equifax's revenue growth accelerated post-2020, reflecting strategic adaptations in a digital-first world. Missing data for 2024 suggests ongoing developments. This comparative analysis highlights the resilience and adaptability of these industry giants, offering valuable insights for investors and stakeholders.
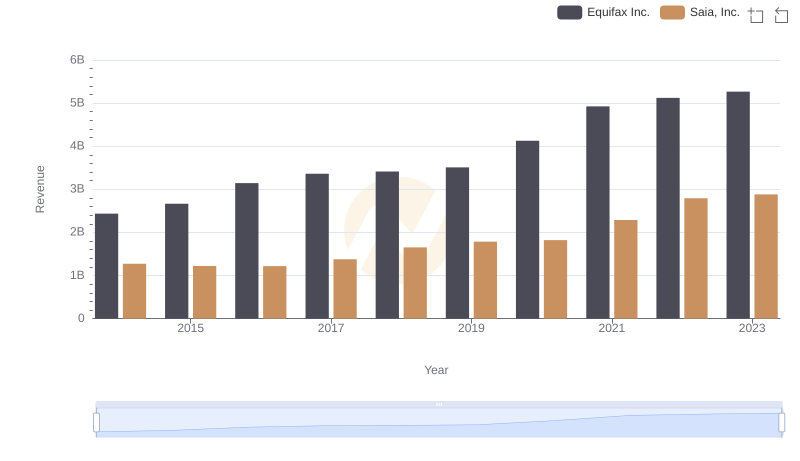
Comparing Revenue Performance: Equifax Inc. or Saia, Inc.?
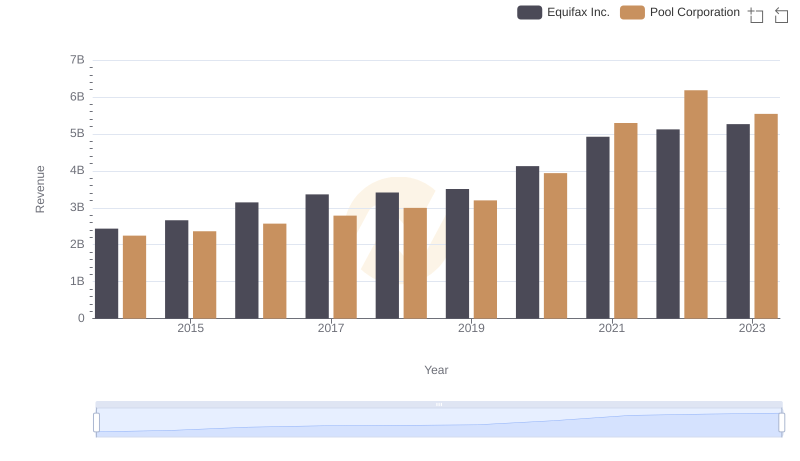
Comparing Revenue Performance: Equifax Inc. or Pool Corporation?
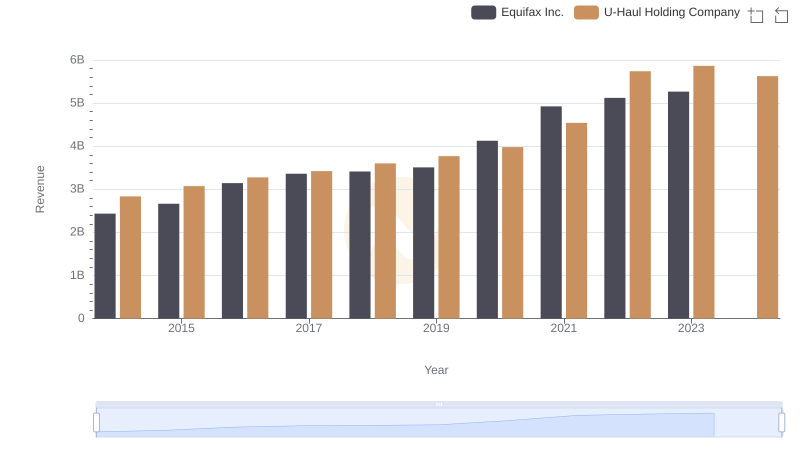
Equifax Inc. or U-Haul Holding Company: Who Leads in Yearly Revenue?
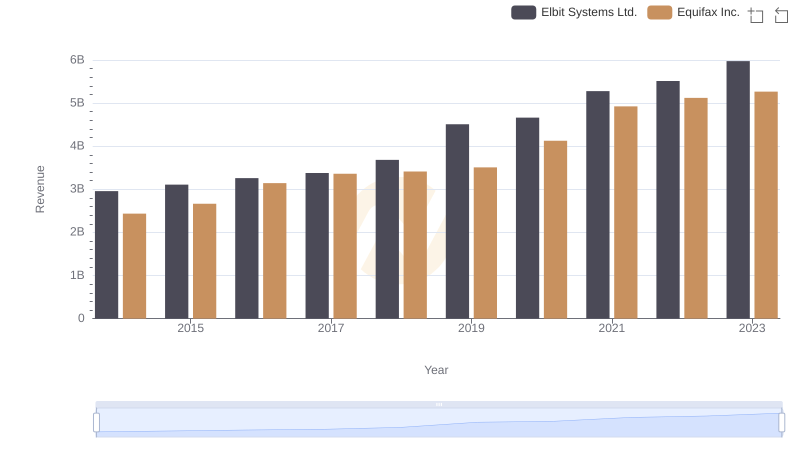
Equifax Inc. or Elbit Systems Ltd.: Who Leads in Yearly Revenue?
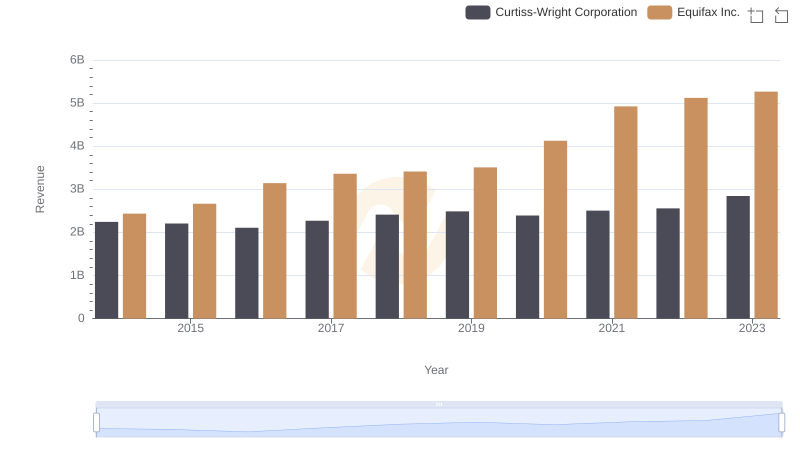
Breaking Down Revenue Trends: Equifax Inc. vs Curtiss-Wright Corporation
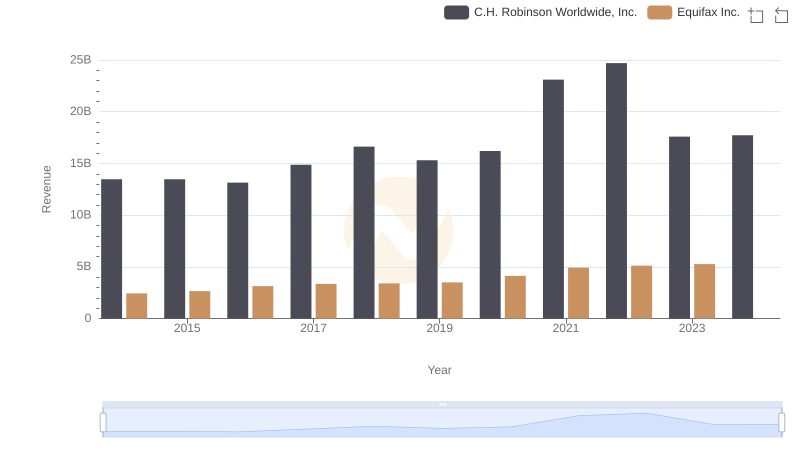
Annual Revenue Comparison: Equifax Inc. vs C.H. Robinson Worldwide, Inc.
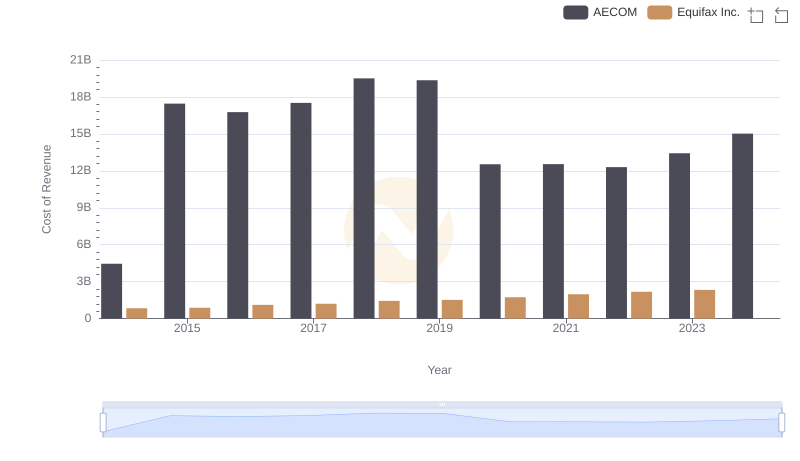
Equifax Inc. vs AECOM: Efficiency in Cost of Revenue Explored
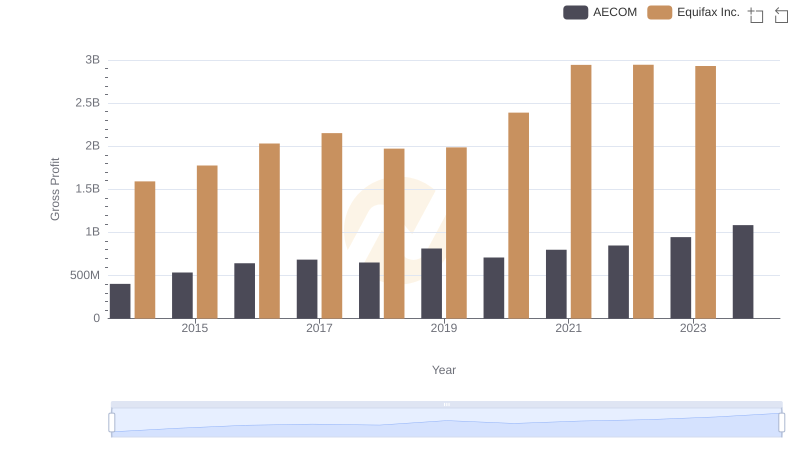
Who Generates Higher Gross Profit? Equifax Inc. or AECOM
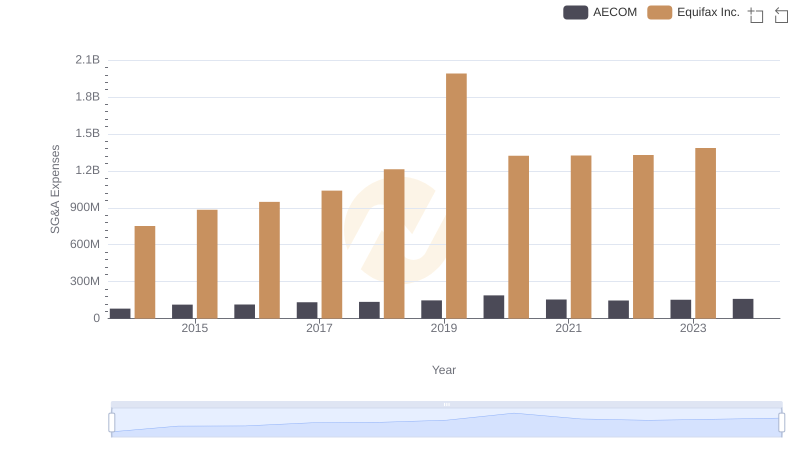
Equifax Inc. and AECOM: SG&A Spending Patterns Compared